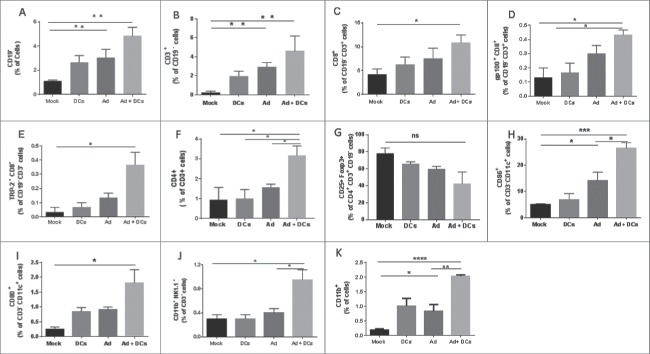
Figure 6.
Immune responses in tumor microenvironment. Percentage of (A) CD19+ B cells, (B) CD3+ (CD19−) T cells (C) CD8+ (CD19−) CD3+ T cells (D) gp100+ CD8+ (CD19−) CD3+ T cells (E) TRP−2+ CD8+ (CD19−) CD3+ T cells (F) CD4+ CD3+ T cells (G) CD25+ Foxp3+ (CD4+ CD3+) regulatory T cells (H) CD86+ CD11c+ CD3− cells (I) CD80+ CD11c+ CD3− cells (J) CD11b+ NK1.1+ CD3− (K) CD11b+ cells in tumors samples which were processed into single-cell suspensions, stained with antibodies and analyzed by flow cytometry. Error bars, SE ***p < 0.001. **,*p < 0.05. Mock (PBS), dendritic cells (DCs) alone, Ad5/3-CMV-mCD40L (Ad) alone and Ad5/3-CMV-mCD40L plus DCs (Ad+ DCs).

