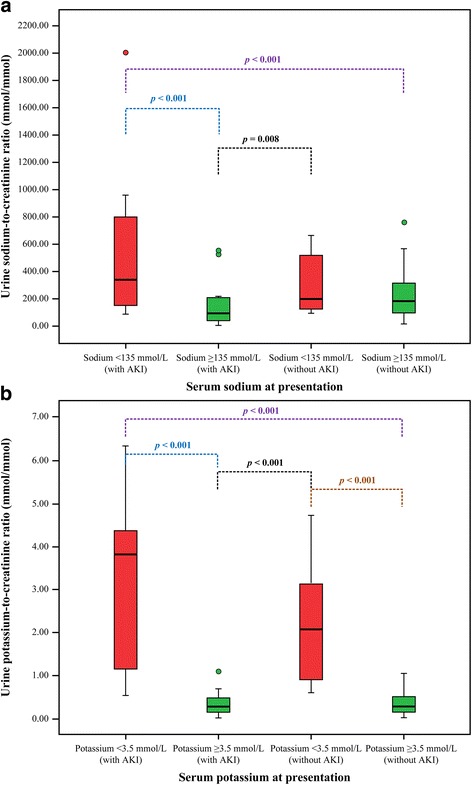
Fig. 3.

Urine electrolyte-to-creatinine ratios and serum electrolytes among 128 patients with normal kidney function at presentation, stratified by the development of acute kidney injury during hospitalization. a Urine sodium-to-creatinine ratio (mmol/mmol) among patients with serum sodium <135 mmol/L and those with serum sodium ≥135 mmol/L. b Urine potassium-to-creatinine ratio (mmol/mmol) among patients with serum potassium <3.5 mmol/L and those with serum potassium ≥3.5 mmol/L. Data are presented as box and whisker plots with median (horizontal line), interquartile range (box), and maximum value within 1.5 of interquartile range (whiskers)
