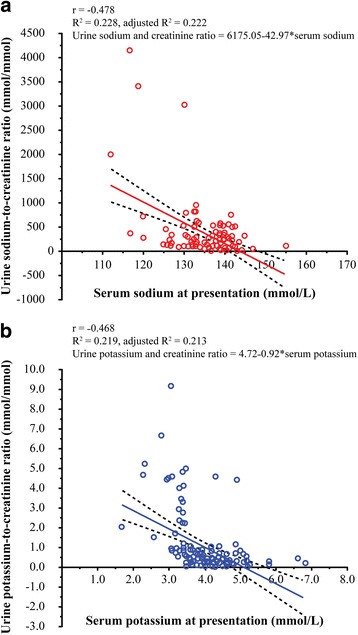
Fig. 4.

Linear regression analysis of urine electrolyte-to-creatinine ratios and levels of serum electrolytes. a Urine sodium-to-creatinine ratio (mmol/mmol) plotted against serum sodium (mmol/L) levels among 128 patients with normal renal function. b Urine potassium-to-creatinine ratio (mmol/mmol) plotted against serum potassium (mmol/L) levels among 128 patients with normal renal function
