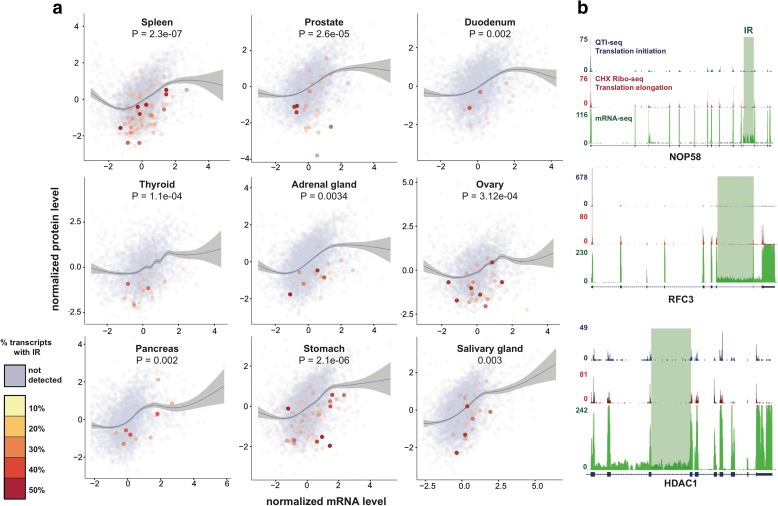
Fig. 2.
IR events alter protein output. a Genes with IR have significantly lower protein output (p values are from multivariate anova comparing mRNA and protein levels between IR and non-IR). Protein and mRNA levels normalized using a standard transformation for nine tissue types. A lowess regression curve shows the correlation between protein and mRNA levels. Genes with IR events are colored according to the maximum IR ratio of retained genes. This ratio reflects the percentage of transcripts that retain introns for a specific gene. b IGV screenshots of CHX Ribo-seq, QTI-seq, and mRNA-seq. Gene structure is displayed below each graph with horizontal lines indicating introns and blocks indicating exons. The sequencing coverage (number of reads) is displayed to the left. IR regions are highlighted in green

