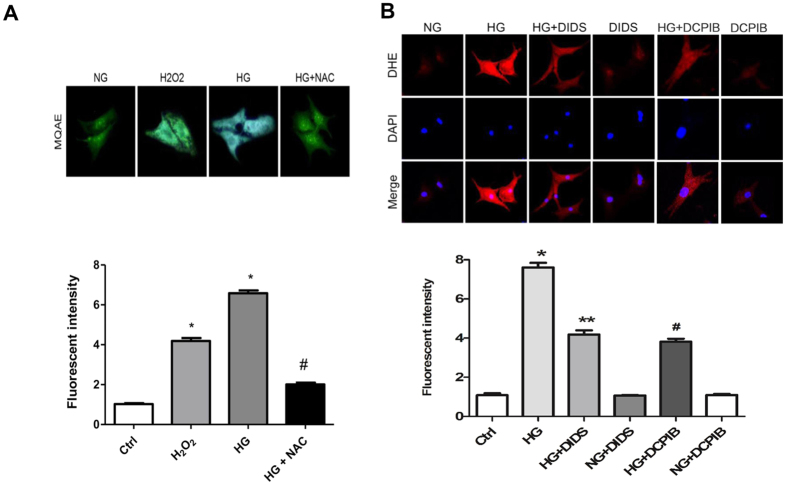
Figure 5. ROS production in high glucose exposed cardiomyocytes.
(A) Visualization of chloride ion via MQAE staining in cardiomyocytes treated with H2O2 (500 μM), glucose (33 mM) and a ROS scavenger, NAC (10 mM). *P < 0.05 v.s. NG group; #P < 0.05 v.s. HG group. n = 5. (B) DHE staining (red) of Effect of cardiomyocytes after normal (Ctrl or NG) and high glucose (HG, 33 mM) exposure for 48 h with or without DIDS (100 μM) and DCPIB (5 μM). Nuclei were counterstained with DAPI. *P < 0.05 v.s. NG group; #P < 0.05 v.s. HG group; **P < 0.05 v.s. HG group. n = 5.

