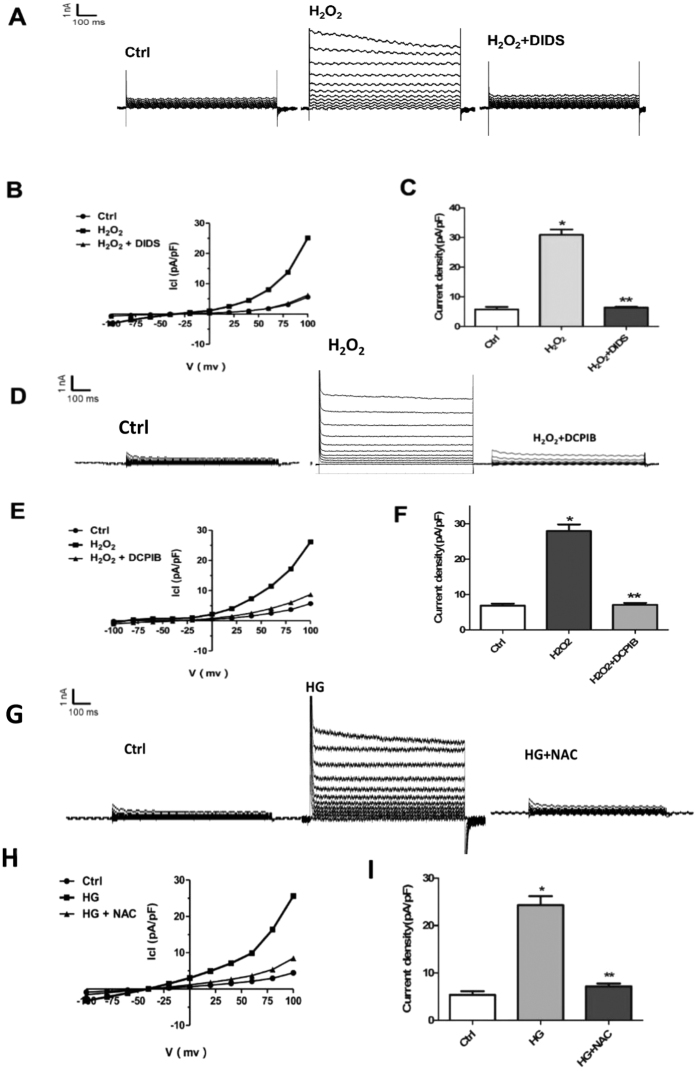
Figure 6. ROS production mediates HG induced VSOR Cl− currents.
(A) Cl− currents recorded under isosmotic solution (Ctrl), H2O2 (500 μM) treatment or H2O2 plus DIDS (500 μM) treatment. n = 5. (B) Corresponding current-voltage (I–V) relationship for the mean current densities of cells subjected to indicated treatments. (C) Current densities at +100 mV from. (B) *P < 0.05 v.s. Ctrl; **P < 0.05 v.s. H2O2 group, n = 5. (D) Cl− currents recorded under isosmotic solution (Ctrl), H2O2 (500 μM) treatment or H2O2 plus DCPIB (10 μM) treatment. n = 5 for each group. (E) Corresponding current-voltage (I–V) relationship for the mean current densities of cells subjected to indicated treatments. (F) Current densities at +10 mV from. (E) *P < 0.05 v.s. Ctrl; **P < 0.05 v.s. H2O2 group, n = 5. (G) Background Cl− currents recorded under isosmotic solution (Ctrl). HG (40 mmol/l)-induced VSOR Cl currents exhibiting phenotypic properties of ICl, Vol (HG). HG-induced VSOR Cl currents were inhibited by the ROS scavenger NAC (10 mM). n = 5 for each group. (H) Corresponding current-voltage (I–V) relationship for the mean current densities of isosmotic (⚫), HG(◼) and HG with NAC (▲) conditions. (I) Current densities at +100 mV from G. *P < 0.05 vs. Ctrl; **P < 0.05 vs. HG, n = 5.

