Fig. 4.
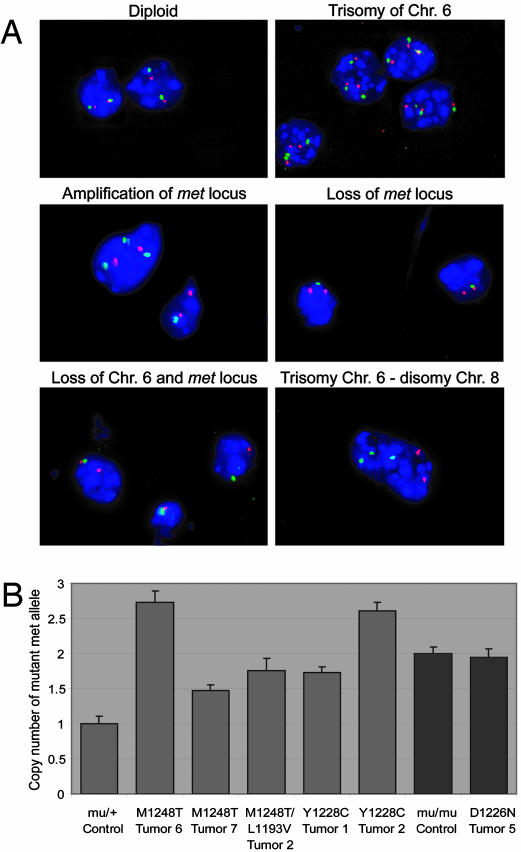
FISH of met mutant tumors. (A) Relative copy number of met was measured by using dual-color interphase FISH on tumor touch preps. Photomicrographs with RP23–416H6 met probe (green), RP24–462C10 probe (red), and DAPI counterstaining are shown as follows: diploid nuclei containing two RP23–416H6 and two RP24–462C10 signals (Top Left); trisomy of chromosome (Chr.) 6 (Top Right); duplication of only the met locus (Middle Left); loss of the met locus (Middle Right); and loss of one copy of Chr. 6 (Bottom Left). (Bottom Right) A photomicrograph of interphase FISH with RP23–416H6 probe (Chr. 6, green), RP23–151I21 probe (Chr. 8, red), and DAPI counterstaining; trisomy of Chr. 6 and disomy of Chr. 8 are present. (B) The number of mutant met alleles was determined by using quantitative PCR. M1248T tumors 6 and 7, M1248T/L1193V tumor 2, and Y1228C tumors 1 and 2 all had significant levels of Chr. 6 trisomy based on FISH analysis (Table 3). The mutant met allele was significantly increased in comparison with the mu/+ control. Based on FISH, D1226N tumor 5 had no Chr. 6 trisomy, and no increase in mutant met was observed by quantitative PCR when compared with the mu/mu control. P values for each comparison are as follows: M1248T tumor 6, P = 2.4 × 10⁻⁵; M1248T tumor 7, P = 0.001; M1248T/L1193V tumor 2, P = 0.002; Y1228C tumor 1, P = 0.0001; Y1228C tumor 2, P = 4.0 × 10⁻⁶; and D1226N tumor 5, P = 0.7.

