
Figure 2.
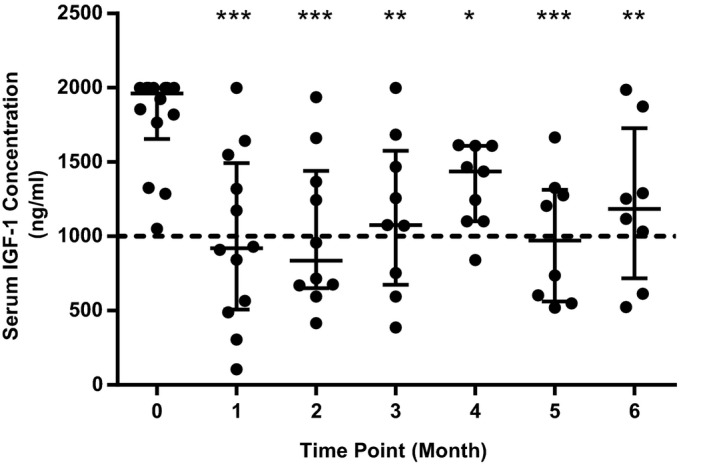
Scatterplot showing individual serum IGF‐1 concentrations at each study time point. Central horizontal bar indicates median value with error bars indicating interquartile range. Dashed line shows recommended cutoff for screening for HS in cats (1000 ng/mL). *, ** and *** indicate a statistically significant difference compared to Month 0 value (* indicates P < .05, ** indicates P < .01, *** indicates P < .001).