
Figure 4.
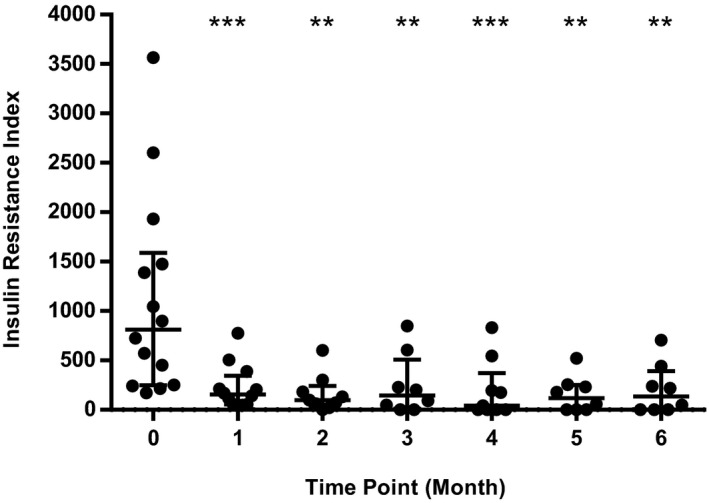
Scatterplot showing individual Insulin Resistance Index values (fructosamine × q12h insulin dose in U/kg) at each study time point. Central horizontal bar indicates median value with error bars indicating interquartile range. ** and *** indicate a statistically significant difference compared to Month 0 value (** indicates P < .01, *** indicates P < .001).