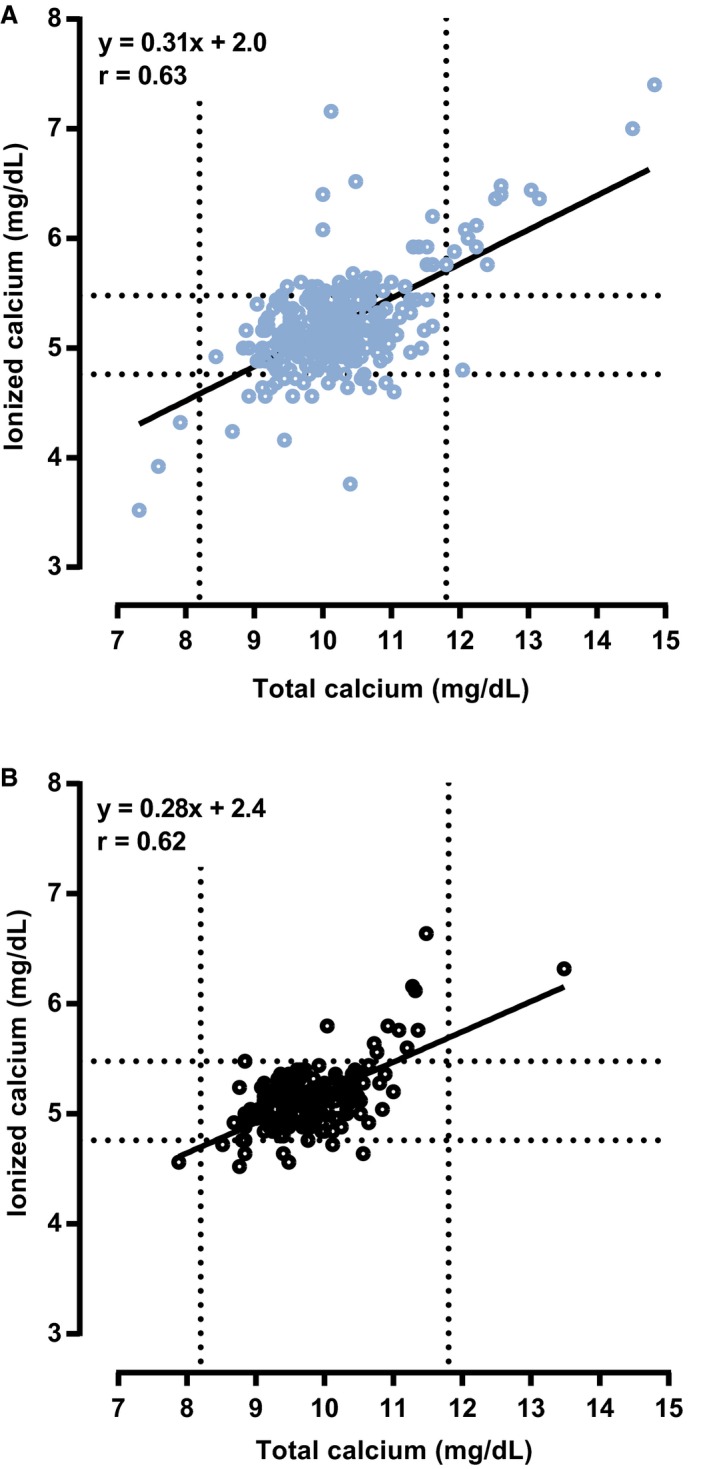
Figure 1.

Scatter plots illustrating the relationship between plasma tCa and whole blood iCa in (A) azotemic (n = 309) and (B) nonazotemic (n = 168) cats. Diagonal black lines represent regression lines. Dashed lines represent the lower and upper limits of the reference intervals for plasma tCa (8.20–11.80 mg/dL) and whole blood iCa (4.76–5.48 mg/dL). r, Pearson's correlation coefficient.
