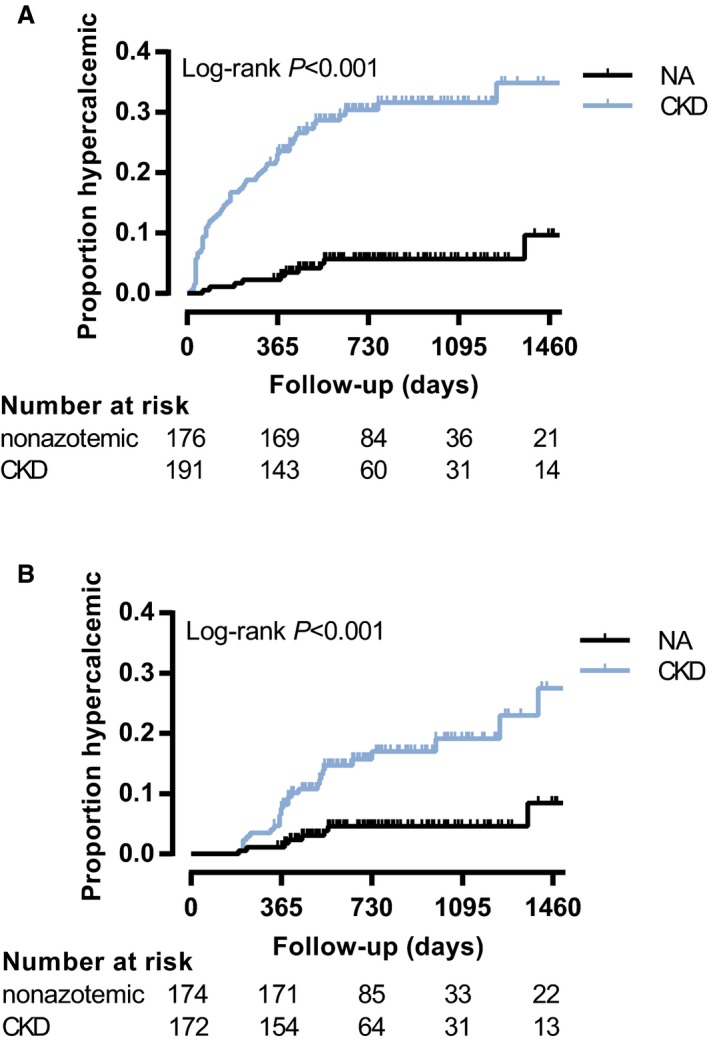
Figure 2.

Kaplan–Meier curves illustrating the development of total hypercalcemia in nonazotemic cats and cats with azotemic chronic kidney disease (CKD). (A) Nonadjusted model. CKD cats (blue curve) were at increased risk of developing total hypercalcemia (n = 191: 60 developed total hypercalcemia, 131 censored) compared to nonazotemic cats (NA, black curve, n = 176: 10 developed total hypercalcemia, 166 censored) with a hazard ratio (HR) of 6.66 (95% confidence interval [CI], 3.41–13.02; P < .001). (B) Model adjusted for frequency of blood sampling. CKD cases (blue curve, n = 172: 30 developed total hypercalcemia, 142 censored) remain at increased risk of total hypercalcemia compared to nonazotemic cats (NA, black curve, n = 174: 8 developed total hypercalcemia, 166 censored) with a HR of 4.29 (95% CI, 1.96–9.37; P < .001).
