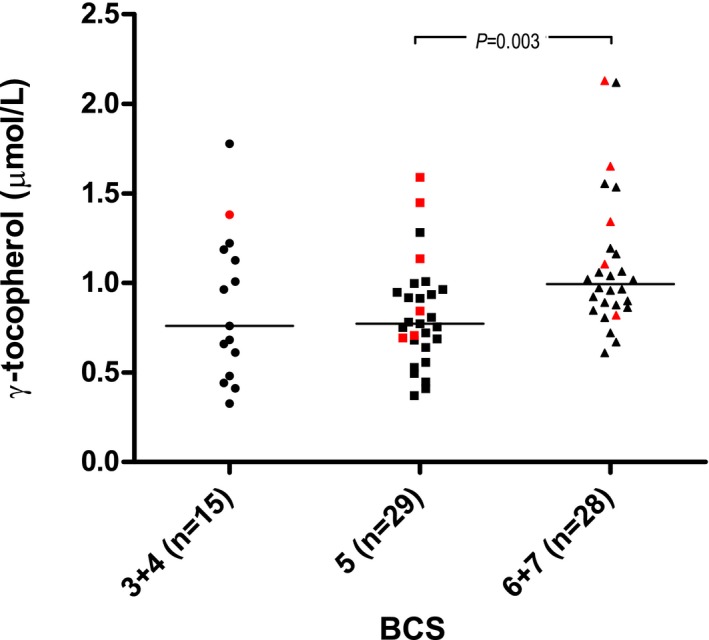
Figure 4.

Raw data plot of plasma γ‐tocopherol concentrations in the different body condition score (BCS) groups. Red symbols indicate dogs that are neutered. Medians are indicated with horizontal lines. Horizontal bars indicate statistically significant comparisons and their P values from multivariable regression analysis. n = 72.
