
Figure 4.
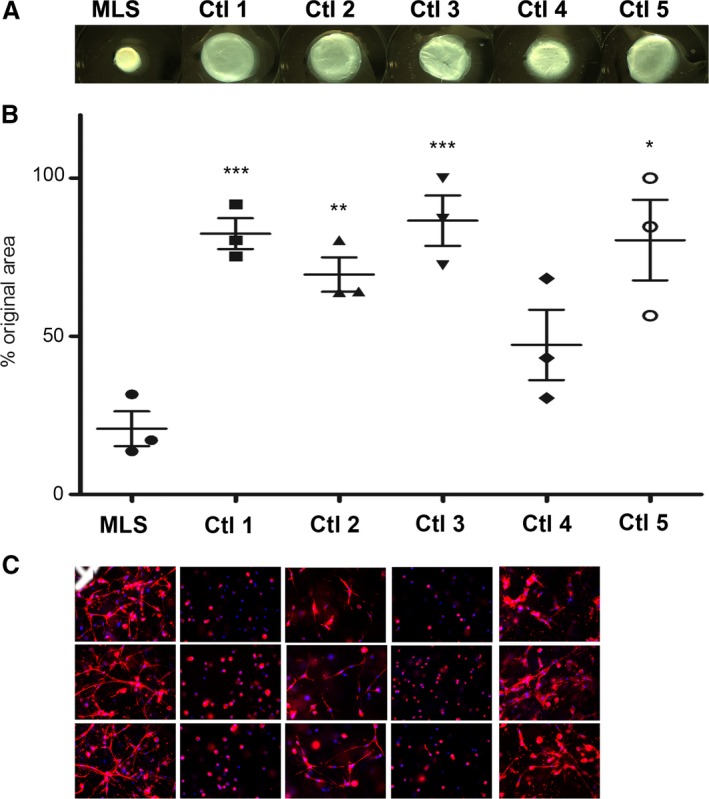
MLS cells contract collagen gels more efficiently than fibroblasts from control dogs (MLS 2, Case 2). Shown are representative images of gels after contraction (A), and the percentage of the original surface area after contraction (mean ± SEM of 3 independent experiments) (B). The significance of the difference between the MLS and control samples was determined with a Student's t‐test (tails 2, type 1), and the P values were found to be <.05 (*), <.01 (**) and <.0003 (***). The difference between MLS and Ctl 4 was not significant. SMA fluorescence of cells in contracted collagen gels (nuclei are stained blue using DAPI) shows comparable cell density but stronger SMA staining and extended morphology of MLS cells (C).