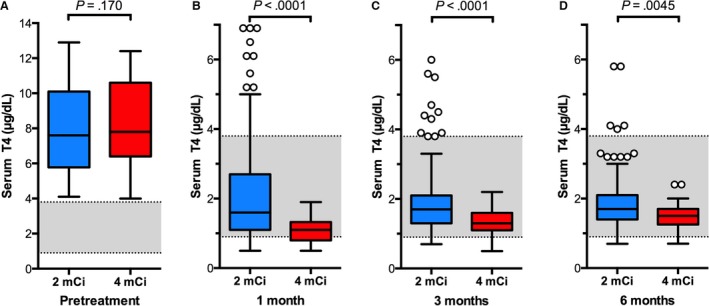
Figure 1.

Box plots of serum T4 concentrations in 189 cats before and after treatment with low‐ (2 mCi; n = 150) or standard‐dose (4 mCi; n = 39) 131I. (A) Before treatment; (B) 1 month after 131I treatment; (C) 3 months after 131I treatment; and (D) 6 months after 131I treatment. The significant differences between the 2 treatment groups are indicated for each time period. Boxes represent the interquartile range (IQR) from the 25th to 75th percentile. The horizontal bar in each box represents the median value. The T‐bars represent the main body of data, which in most instances is equal to the range. Open circles represent outlying data points.
