Figure 3.

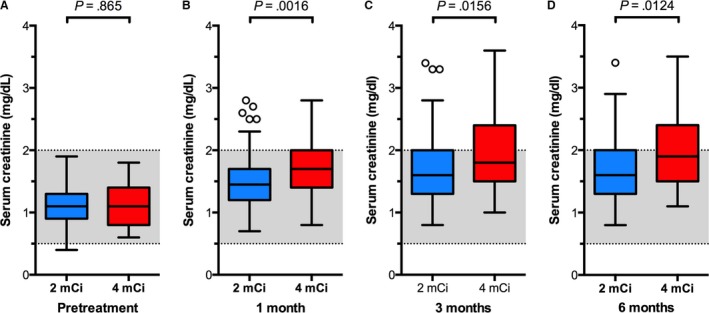
Box plots of serum creatinine concentrations in 189 cats before and after treatment with low‐ (2 mCi; n = 150) or standard‐dose (4 mCi; n = 39) 131I. Data are plotted as in Fig. 1.

Box plots of serum creatinine concentrations in 189 cats before and after treatment with low‐ (2 mCi; n = 150) or standard‐dose (4 mCi; n = 39) 131I. Data are plotted as in Fig. 1.