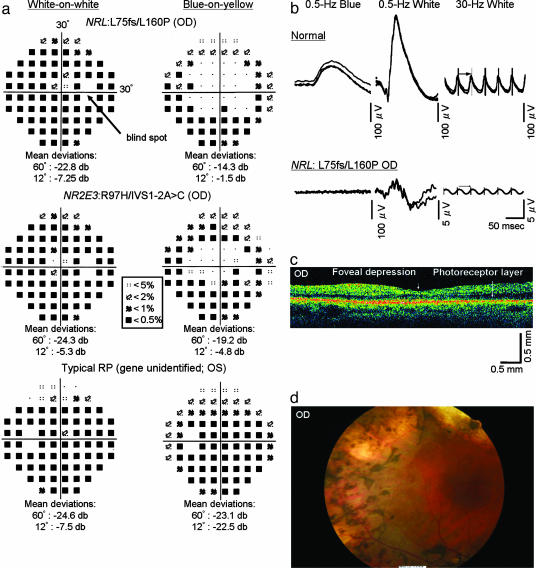
Fig. 4.
Clinical analyses of a patient with the recessive NRL mutations L75fs and L160P and two control patients. (a) Humphrey automated static perimetry performed on the right eye of a patient with recessive NRL mutations (Top), the right eye of a patient with enhanced S-cone syndrome with recessive NR2E3 mutations (Middle), and the left eye of a patient with typical RP and no identified mutations (Bottom). The fields were measured separately with W/W (Left) and B/Y (Right) protocols. Threshold deviations from normal controls are presented as different symbols (see code in central box). Below each field are the mean deviations in sensitivities in the central 60° and 12° compared with age-matched norms from the instrument's database. The location of the blind spot is shown in Top Left by an arrow. (b) Dark-adapted, full-field ERGs from a normal control individual (Upper) and the NRL patient (Lower). The columns show rod responses to 0.5-Hz blue flashes [1.2 log foot Lambert (ft.-L.), λmax = 440 nm] (Left), rod-plus-cone responses to 0.5-Hz white flashes (3.8 log ft.-L.) (Center), and cone responses to 30-Hz white flashes (3.8 log ft.-L.) (Right). Scale bars are at the lower-right corner of each ERG. For each test condition, two to four consecutive sweeps are shown to illustrate reproducibility, except for the 0.5-Hz white and 30-Hz white ERGs of the NRL patient, for which computer-averaged ERGs are shown because these ERGs were nondetectable otherwise. (c) Optical coherence tomography image of the right eye of the NRL patient. Scale bars are at the lower right corner. Arrowhead indicates foveal depression. Arrow indicates the preserved photoreceptor layer. (d) Fundus photo of the right eye of the NRL patient showing clumped pigment deposits in the periphery, attenuated retinal vessels, and regions of chorioretinal atrophy.

