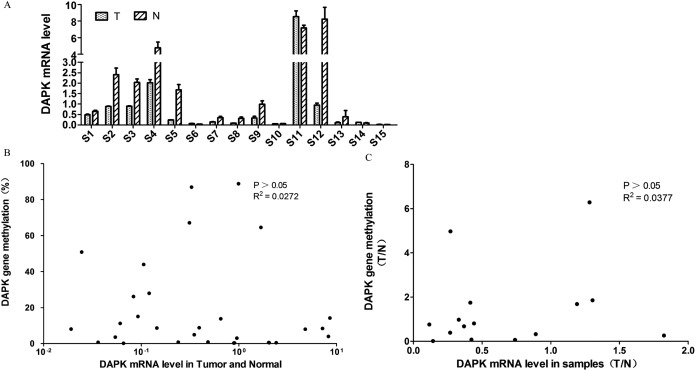
Figure 2. Analysis of the correlation between DAPK mRNA and promoter methylation in breast cancer samples.
(A) The mRNA expression of DAPK was detected using real-time PCR. S1–S15, patient codes. The cDNA from HEK293T cells were used as a positive control and formation of the standard curve. (B) Correlation analysis of DAPK mRNA expression and DAPK promoter methylation rate in breast cancer samples. (C) Correlation analysis of the T/N ratio of DAPK mRNA expression and DAPK promoter methylation rate in breast cancer samples.

