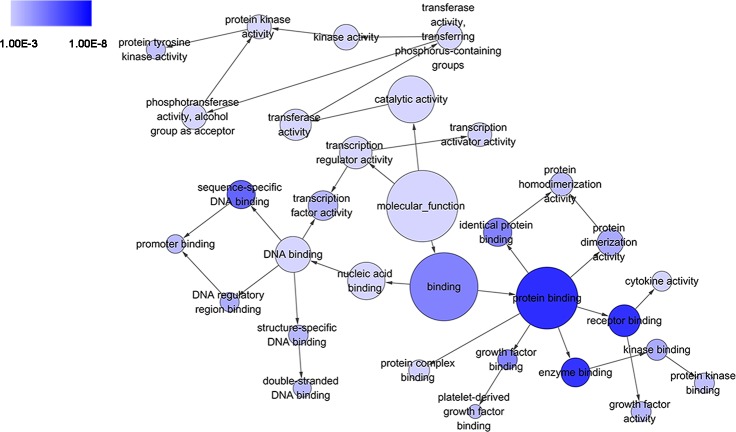
Figure 5. DAG of pathways from the perspective of molecular function (MF) in GO analysis.
The circles represented different terms of molecular functions. The relationships among terms were represented by arrows. A false discovery rate (FDR) of 10−3 was selected for the current DAG, which held 32 nodes and 35 edges. The color depth indicated the significance of the corresponding term.

