
Figure 3.
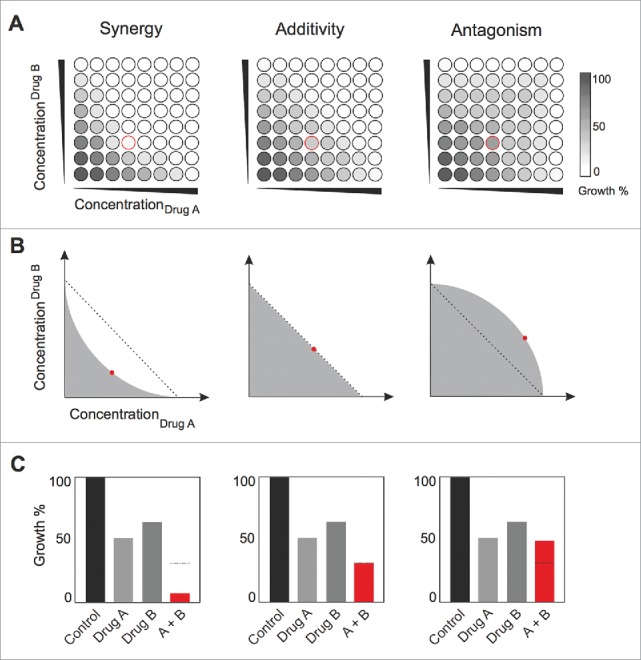
Loewe additivity and Bliss independence to define drug interactions. (A) Checkerboards that are representative of synergistic, indifferent and antagonistic drug interactions. Concentrations of drugs A and B increase along the x and y-axis, respectively. (B) Representative isoboles for synergistic, additive and antagonistic drug interactions based on the Loewe model. The x and y-axis represent the concentration of drugs A and B necessary to achieve a defined growth inhibition level X. The dashed line indicates additivity and is constructed by connecting the ICX values for drugs A and B. Concentration pairs for drugs A and B used in combination to achieve the same growth inhibition X are added to this plot (red dots). The position of these points below, on or above the line result in concave, linear or convex isoboles and indicate synergistic, indifferent or antagonistic drug interactions, respectively. (C) Examples of drug interactions that are synergistic, indifferent and antagonistic according to the Bliss independence model. Growth in the presence of drugs A and B (red bars) is compared to the expected growth in the presence of the drug combination (Ecombo) based on treatment with drugs A and B alone: Ecombo = GDrug A*GDrug B (indicated by dashed line). If the observed growth is less than expected, a drug combination is classified as synergistic. Conversely, more growth than expected indicates an antagonistic drug interaction.