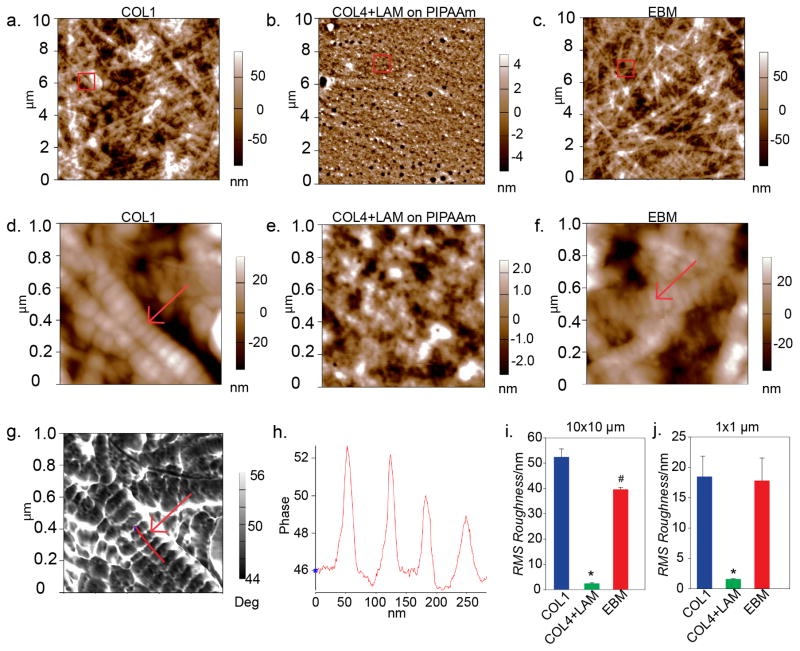
Figure 3. The EBM has a nanostructure similar to a native basement membrane.
Atomic force micrographs showing the nanostructure of COL1 (a, d), COL4+LAM assembled on PIPAAm (b, e) and EBM (c, f). The red boxes indicate the area of the 10 μm × 10 μm scan that was selected for the 1 μm × 1 μm scan. (a) The COL1 gel has short fibers creating a network with no orientation and an average RMS roughness of 52.468 ± 3.178 nm. (b) The COL4+LAM assembled on the PIPAAm is much smoother, with an average RMS roughness of 2.435 ± 0.279 nm, which resembles that of the native basement membrane mesh-like structure. (c) The finished EBM has a surface structure that resembles that of COL1 with an average RMS roughness on the same order of magnitude at 39.665 ± 0.783 nm. (d) A 1 μm × 1 μm scan shows the structure of the COL1 fibers in the gel indicated by the red arrow with an average RMS roughness of 18.472 ± 3.375 nm. (e) The mesh like network of the COL4+LAM can be seen at a 1 μm × 1 μm scan size which has an RMS roughness of 1.610 ± 0.0404 nm. (f) A closer view of the finished EBM shows the surface structure. The similarity between COL1 and EBM is highlighted by the arrows in D and F indicating the structure of the COL1 fibers dominates the topography in both the COL1 and EBM. At the 1 μm × 1 μm scan size, the EBM has an average RMS roughness similar to that of COL1, 17.718 ± 3.726 nm. (g) The corresponding phase image from panel (D), showing a trace (red line) used to measure the width of the banding of the COL1 fibers. (H) A graph that corresponds to the red trace line on panel G showing the change in phase height as the AFM cantilever went over the edges of the bands on the COL1 fiber. The distance between the peaks corresponds to the width in nanometers of each band. (I) A graph showing the average RMS roughness of the samples at the 10 μm scan size. The data was compared using a One-way ANOVA with Tukey test (p<0.05). The RMS roughness of the COL4+LAM on PIPAAm is significantly lower compared to both the EBM and COL1 (*, p < 0.001) and RMS roughness of the EBM is significantly lower, though on the same order of magnitude, as COL1 (#, p <0.001). (J) A graph showing the average RMS roughness of the samples at the 1 μm scan size. The data was compared using a One-way ANOVA with Tukey test (p<0.05). The RMS roughness of the COL4+LAM on PIPAAm is significantly lower compared to both the EBM and COL1 (*, p = 0.001).

