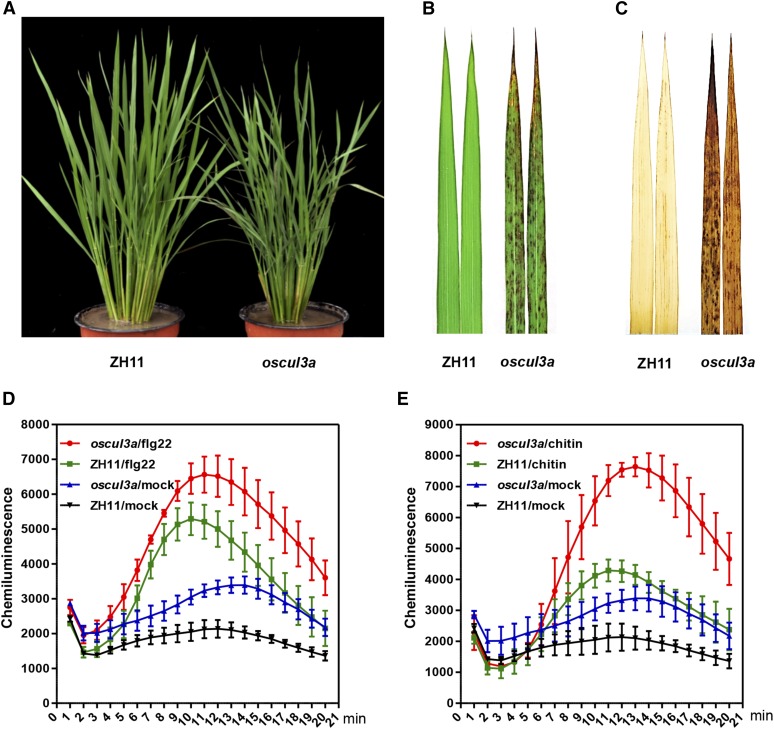
Figure 1.
Identification of the Lesion Mimic Mutant oscul3a.
(A) oscul3a mutant and ZH11 plants were grown in the field and photographed at 60 dps.
(B) Leaves of oscul3a mutant and ZH11 plants at 60 dps.
(C) DAB staining of the oscul3a mutant and ZH11 leaves shown in (B).
(D) ROS accumulation dynamics in oscul3a mutant and ZH11 plants after flg22 and water (mock) treatments. Error bars represent the se; n = 3.
(E) ROS accumulation dynamics in oscul3a mutant and ZH11 plants after chitin and water (mock) treatments. Error bars represent the se; n = 3.

