Figure 3.
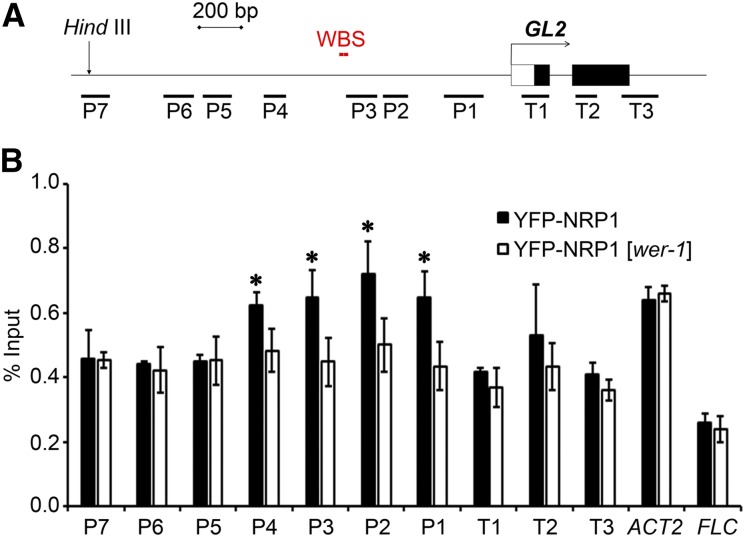
Enrichment of NRP1 at GL2 Promoter Is Dependent on WER.
(A) Schematic representation of structures of GL2 promoter and first two exon/introns. Black boxes represent exons, white box represents the untranscribed region, lines represent promoter and introns. Number-labeled bars (P1–P7 and T1–T3) represent regions amplified by primer pairs corresponding to numbers on x axis of graph below. The HindIII site represents start of GL2 functional promoter and WBS indicates the location of the WER binding sites.
(B) Enrichment of YFP-NRP1 at the GL2 promoter. Roots of plants vertically grown and collected at 12 DAG were fixed with formaldehyde for ChIP analysis using polyclonal anti-GFP antibody. Error bars show sd from three biological replicates. Asterisks indicate statistically significant difference of YFP-NRP1 enrichment at GL2, FLC, and ACTIN2 (ACT2) between the wild type and wer-1 (P < 0.05).

