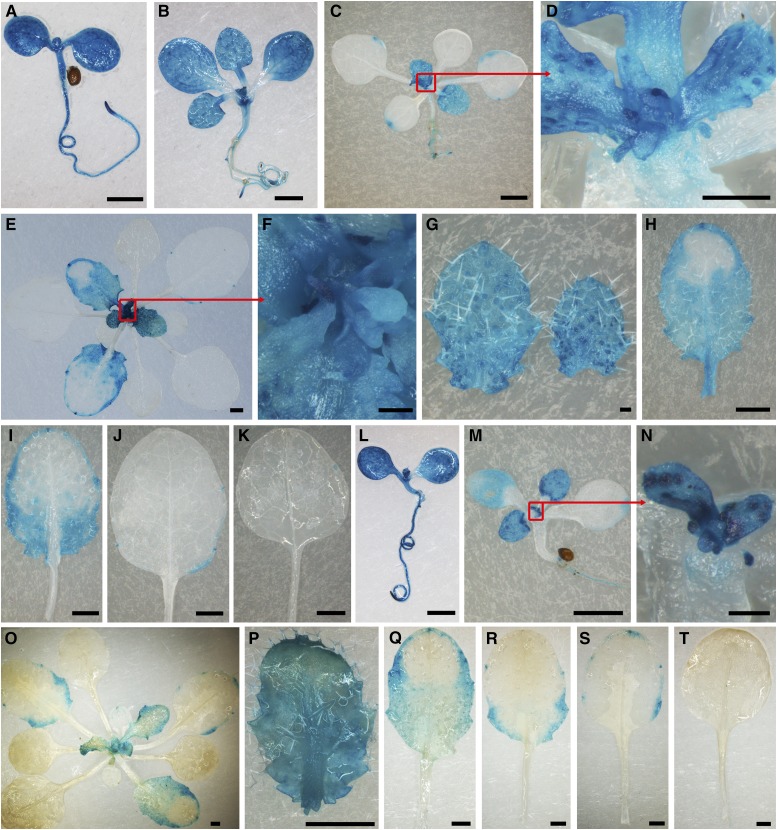
Figure 3.
Expression Patterns of TEAR1 and TEAR2.
(A) to (K) The expression pattern analysis of TEAR1 based on GUS staining in TEAR1pro-GUS-6.
(A) Six-day-old seedling.
(B) Ten-day-old seedling.
(C) Fifteen-day-old plant.
(D) Close-up view of SAM (boxed in [C]) from 15-d-old plant.
(E) Twenty-four-day-old plant.
(F) Close-up view of SAM (boxed in [E]) from 24-d-old plant.
(G) to (K) Close-up view of the young to old leaves from a 24-d-old plant.
(L) to (T) Expression pattern analysis of TEAR2 based on GUS staining in TEAR2pro-GUS-5.
(L) Six-day-old seedling.
(M) Ten-day-old seedling.
(N) Close-up view of SAM (boxed in [M]) from 10-d-old plant.
(O) Twenty-four-day-old seedling.
(P) to (T) Close-up view of the young to old leaves from a 24-d-old plant.
Bars = 1 mm in (A) to (C), (E), (H), (I) to (M), and (O) to (T) and 0.1 mm in (D), (F), (G), and (N).

