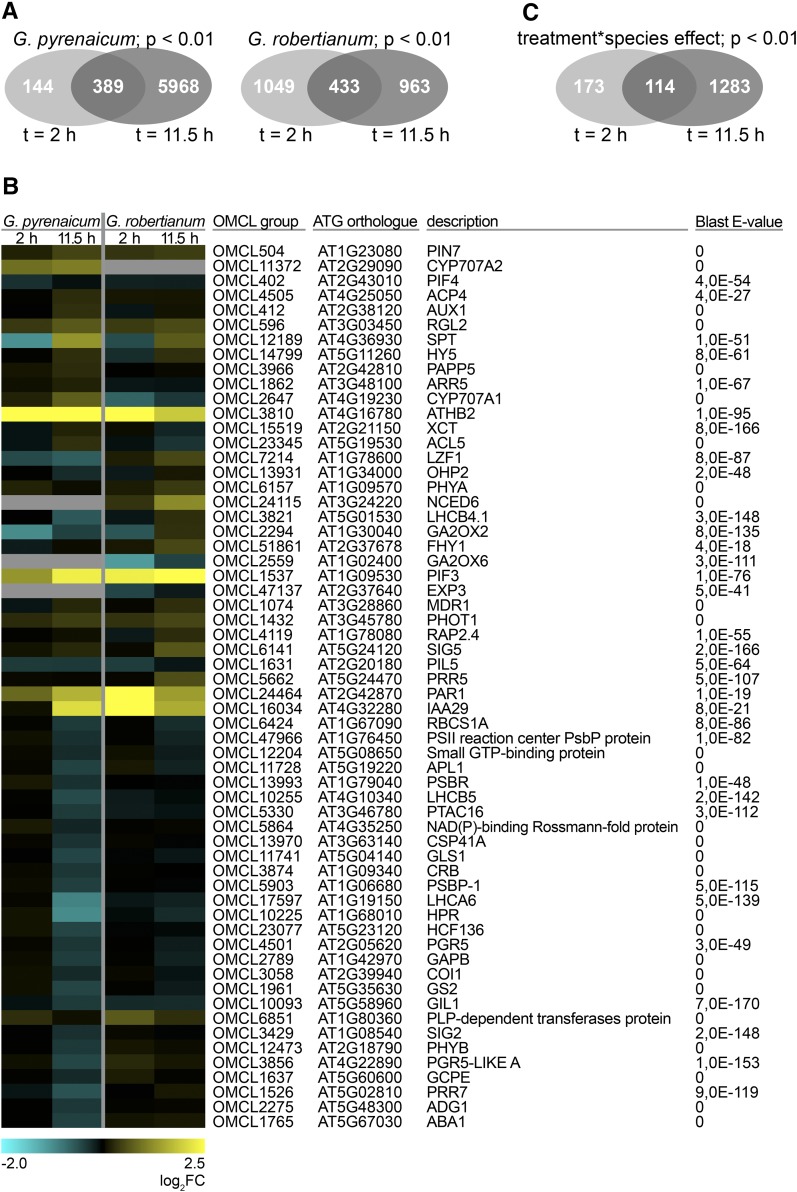
Figure 3.
Low R:FR Light Differentially Affects G. pyrenaicum and G. robertianum Gene Expression.
(A) Venn diagrams representing overlap of the differentially expressed OMCL groups upon the low R:FR treatment (up- and downregulated, P < 0.01, qCML method, followed by an exact test) between the two different time points for G. pyrenaicum (upper) and G. robertianum (lower) separately.
(B) Heat map representing expression values of Geranium orthologs of Arabidopsis genes appointed to the GO terms “R or FR light signaling pathway,” “response to R or FR light,” “shade avoidance,” “response to R light,” “response to FR light,” “R light signaling pathway,” and/or “FR light signaling pathway,” which are significantly (P < 0.01, qCML method, followed by an exact test) induced or repressed by a low R:FR treatment at at least one time point (2 or 11.5 h) in at least one species (G. pyrenaicum or G. robertianum). Colors represent the log2 fold change upon the low R:FR treatment. The ATG code and description of the closest Arabidopsis ortholog is given for each Geranium OMCL group, with matching E-value of the BLAST hit. Gray areas represent the absence of this OMCL group in this species.
(C) Venn diagram showing the number of OMCL groups with a significant treatment*species interaction (P < 0.01, glmLRT) and overlap between the two time points.

