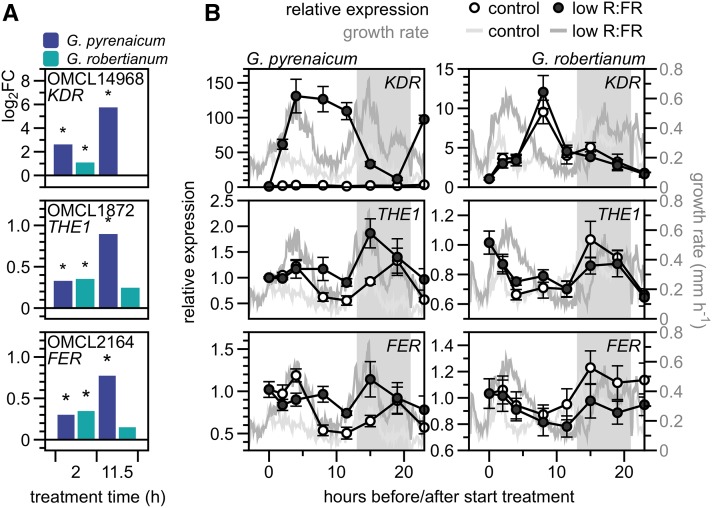
Figure 6.
G. pyrenaicum and G. robertianum Differentially Express KDR, THE1, and FER in Low R:FR Light over Time.
(A) Log2 fold changes of OMCL14968 (KDR ortholog), OMCL1872 (THE1), and OMCL2164 (FER) in G. pyrenaicum (dark-blue bars) and G. robertianum (turquoise bars). Asterisks represent significant transcriptional regulation (low R:FR versus control, adjusted P < 0.01, qCML method, followed by an exact test).
(B) Relative OMCL group expression over time in G. pyrenaicum (left panels) and G. robertianum (right panels) petioles in control (open circles) and low R:FR (dark circles) on the left y axis. Data are relative to the reference gene (ortholog of PDF1) and to t = 0 (10:00 am) and represent means ± se, n = 5 (biological replicates are a pool of the second petiole of three individual plants). Right y axis and gray lines represent growth rates in mm h−1 over the same time period in control (light gray) and low R:FR (darker gray) conditions (same data as Figure 1C). Gray area represents the night period.

