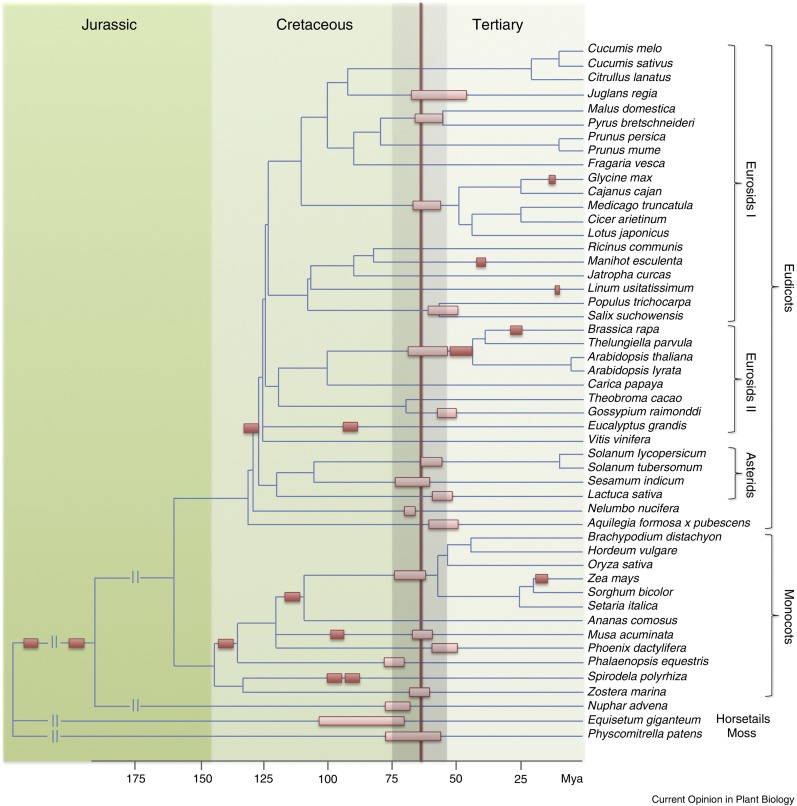
Figure 1.
Schematic Tree of Evolutionary Relationships for Sequenced Plants.
Ancient plant polyploidies (orange rectangles) are distributed with respect to the inferred Cretaceous (K)/Tertiary (Pg) boundary (centered around the vertical brown line). Lighter colored rectangles indicate whole-genome duplications estimated between 55 and 75 million years old (shaded area around the K/Pg boundary). Only lineages that survived to this day are shown. (Reproduced from Lohaus and Van de Peer [2016], http://dx.doi.org/10.1016/j.pbi.2016.01.006, under a Creative Commons Attribution-Noncommercial-No Derivatives License https://creativecommons.org/licenses/by-nc-nd/4.0/.)

