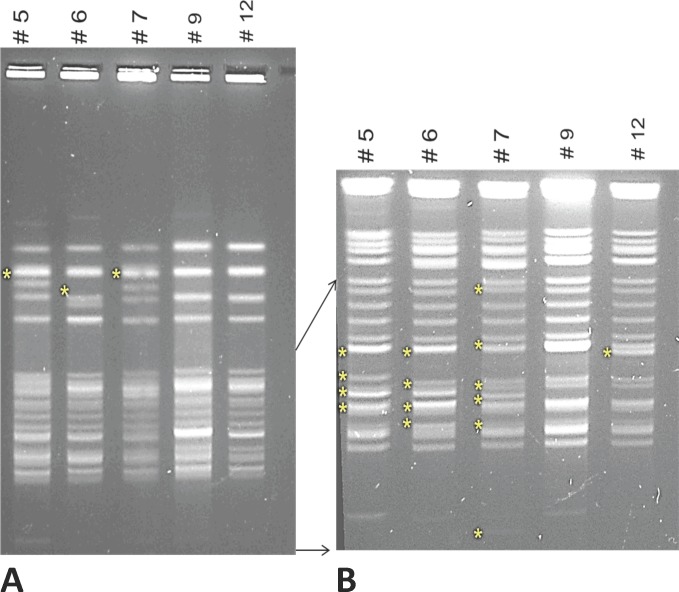
Fig 2. Agarose gel showing SmaI digestion patterns of strains via PFGE.
(A) PFGE gel of VRE 5, 6, 7, VRE Recipient and VRE Donor isolates with ramped pulse times of 2s to 28s to resolve higher-molecular weight fragments. (B) Same as A but with ramped pulse times of 2s to 7s to resolve low-molecular weight fragments. Asterisks (*) indicate missing or variable DNA band sizes among isolates. Arrows indicate the corresponding higher resolution DNA band area in panel B relative to panel A.

