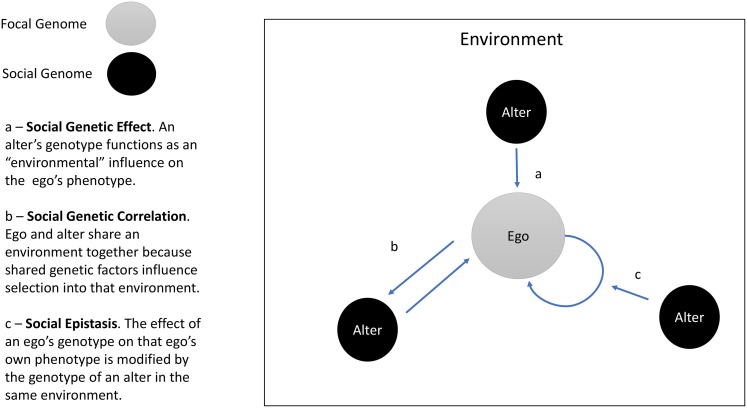
Fig 1. Social Genetic Effects (SGEs), social genetic correlation, and social epistasis.
The figure illustrates three social genetic processes: SGEs, social genetic correlation, and social epistasis. The circle labeled “ego” represents the focal individual in an analysis. The circles labeled “alter” represent other individuals within the ego’s social environment. The arrows depict social genetic processes.

