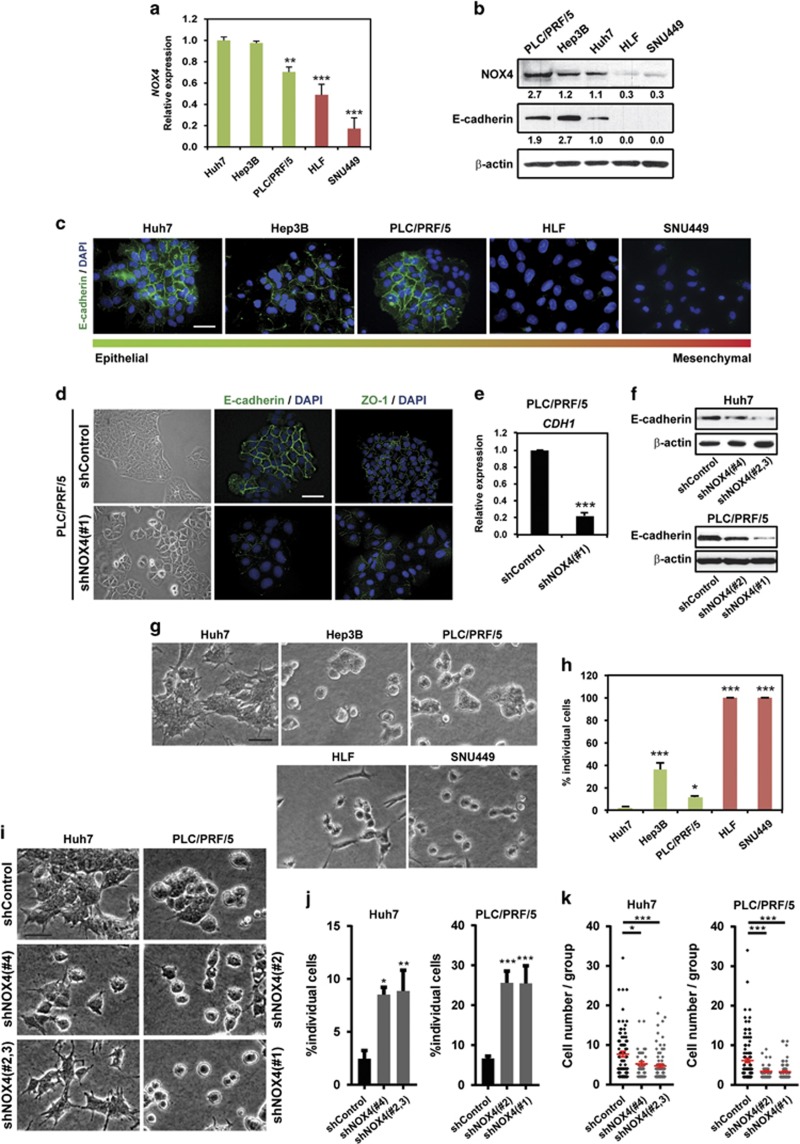
Figure 1.
NOX4 regulates cell–cell adhesion in HCC cells. (a) NOX4 expression levels by quantitative PCR. Data represent the mean±s.e.m. (N=4). (b) NOX4 and E-cadherin protein levels by western blot. β-actin was used as loading control. A representative experiment is shown (N=3). Quantification normalized by loading control is shown under each blot. (c) Immunofluorescence of E-cadherin (green) and DAPI (blue; scale bar, 50 μm). (d) Representative bright-field images of cells cultured at basal conditions on top of plastic (left). Cell–cell contact imaging by immunofluorescence of E-cadherin (green) and ZO-1 (green); DAPI (blue; N=3; scale bar, 50 μm; right). (e) Analysis of CDH1 (E-cadherin) expression in PLC/PRF/5 cells by quantitative PCR. Data are mean±s.e.m. (N=4). (f) E-cadherin protein levels by western blot. β-actin was used as loading control. A representative experiment is shown (N=3). (g) Representative bright-field images of human HCC cells cultured on top of a bovine collagen I matrix (scale bar, 50 μm). (h) Quantification of the percentage of individual cells in each case. (i) Representative bright-field images of cells on top of a bovine collagen I matrix when NOX4 expression is silenced (scale bar, 50 μm). (j) Quantification of the percentage of individual cells in each case. (k) Number of cells per group. In (h, j and k) data are mean±s.e.m. (N=4). See also Supplementary Figures 1 and 2.

