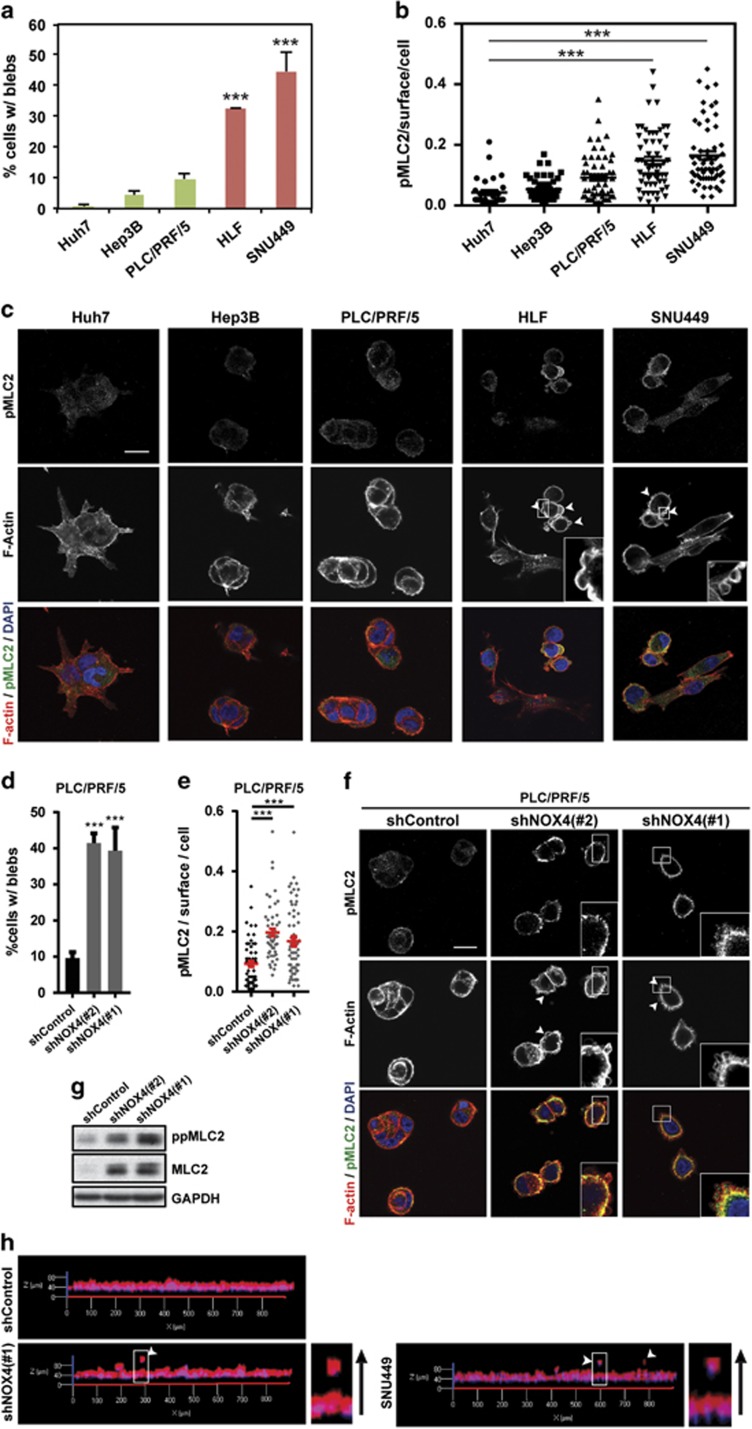
Figure 4.
NOX4 suppresses actomyosin contractility in HCC cells. In all experiments cells were cultured on top of a bovine collagen I matrix. (a and d) Percentage of cells with blebs. (b and e) quantification of phosphorylated MLC2 (pMLC2) immunostaining intensity per cell surface. (c and f) Representative confocal images of pMLC2 (green), F-actin (red) and DAPI (blue) staining (N=4; scale bar, 20 μm, square with a higher magnification is shown for better visualisation). White arrows indicate blebs. Data in (a, b, d and e) are mean±s.e.m. (N=4, at least five pictures per experiment). (g) Phosphorylated and total MLC2 protein levels. GAPDH was used as loading control. A representative experiment is shown (N=3). (h) 3D imaging of PLC/PRF/5 (shControl and shNOX4) and SNU449 cells invading a collagen I/matrigel mix (1:1) matrix. Higher magnification is shown for better visualization. Black arrow indicates direction of invasion.

