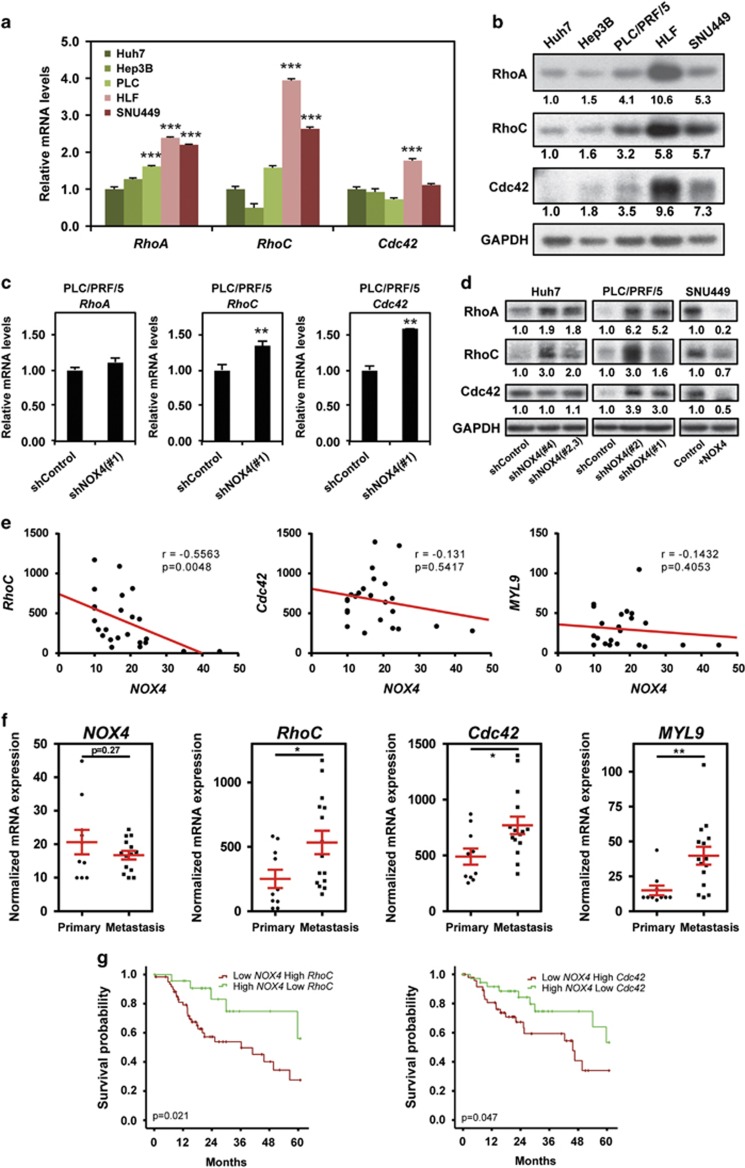
Figure 6.
NOX4 suppresses the actomyosin regulators RhoA/C and Cdc42. (a and c) RhoA, RhoC and Cdc42 GTPases mRNA expression levels analysed by quantitative PCR. Data represents the mean±s.e.m. (N=4). (b and d) Representative western blot of RhoA, RhoC and Cdc42 GTPases. GAPDH was used as loading controls (N=3–5). Quantification normalized by loading control is shown under each blot. (e) Scatter plots of NOX4, RhoC, Cdc42 and MYL9 (MLC2) expression correlation analysis using normalized mRNA expression data from GEO data sets (accession number GSE40367). (f) NOX4, RhoC, Cdc42 and MYL9 (MLC2) expression levels comparing primary tumour versus metastasis using same data set as in e. (g) Kaplan–Meier estimates of 5 years survival in The Cancer Genome Atlas HCC patients according to NOX4 expression combined with RhoC and Cdc42 expression.

