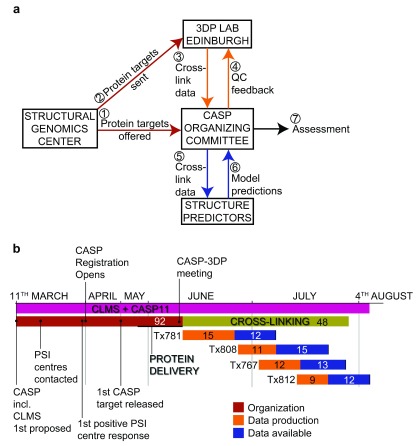
Figure 1. Organization of CASP11 including cross-linking/mass spectrometry.
( a) Schematic representation of the interactions between CASP11 participants. ( b) CASP11 and CLMS timeline. Total duration of CASP11 and CLMS denoted by the pink bar. Duration of organizational aspects denoted by the red bar. Duration of the cross-linking and mass spectrometry aspect denoted by the green bar. Numbers within the timeline bars denote the number of days in duration for that particular element.

