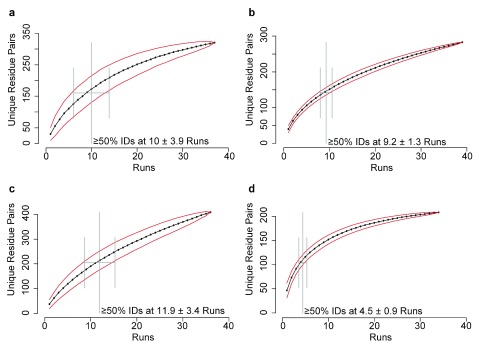
Figure 2. Saturation analysis: Residue pair identifications accumulated over runs.
( a) – ( d) Total number of unique residue pairs (5% FDR) increases with each successive LC-MS run. The order of LC-MS runs in the series was permutated 100 times and the mean increase per run in all permutations is plotted. ( a) Target 1-Tx781. ( b) Target 2-Tx808. ( c) Target 3-Tx767. ( d) Target 4-Tx812.

