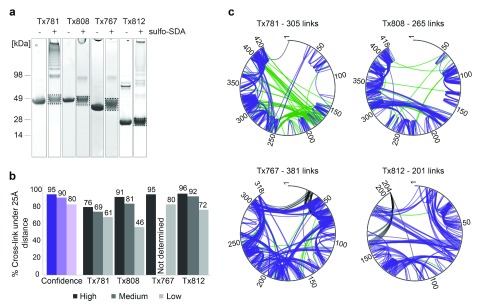
Figure 3. Target cross-linking FDR estimation analysis.
( a) CASP11 targets (Tx781, Tx808, Tx767 and Tx812), with (+) and without (-) sulfo-SDA cross-linking. ( b) FDR analysis and quality control. FDR estimation on blind data given by the purple columns. Three confidence levels were provided for each target: high (95% true positive hits), medium (90% true positive hits) and low (80% true positive hits). Black and grey columns represent the results of a data QC check by the CASP Organizing Committee, following submission of cross-linking data by 3DP Lab Edinburgh. Numbers on top of black and grey columns represent the percentage of cross-links found in the known crystal structure that had Cα-Cα cross-linking distances of over 25 Å. ( c) Cross-link networks for four CASP targets shown for estimated 5% FDR cut-off. Constraints with Cα-Cα cross-linking distances less than 25 Å are shown in purple, constraints with distances 25 Å and over are shown in green and constraints missing from the crystal structure and therefore unverifiable are represented in black.

