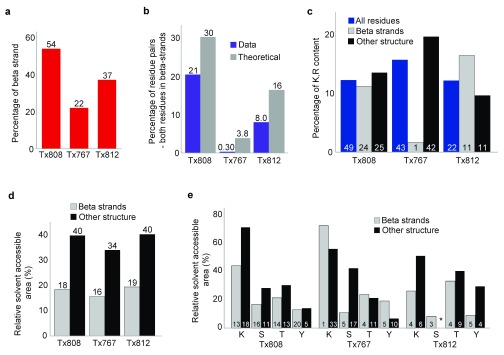
Figure 7. Beta strand analysis for targets Tx808, Tx767, Tx812.
( a) Percentage of residues with beta strand structure. ( b) Percentage of residue pairs where both residues are beta strand in identified cross-link data compared with the dataset where all possible residue pairs are considered. Residue pairs identified at 5% FDR shown by purple columns. All possible residue pairs with both residues in beta strand shown by grey columns. ( c) Percentage of Lys and Arg residues in beta strands versus residues with all other structure types. Percentages of Lys and Arg residues across all residues for each target are shown by blue columns. Percentages of Lys and Arg residues in beta strands for each target are shown by grey columns. Percentage of Lys and Arg residues for all residues, excluding those with beta strand structure are shown by black columns. Numbers within columns refer to the numbers of Lys and Arg found in the crystal structure of each target. ( d) Average relative solvent accessible area (RSA) of residues for each target in beta strands compared with average RSA for all other residues, excluding beta strand residues. Average RSAs of beta strand residues are shown by grey columns. Average RSAs of all other residues, excluding beta strand residues, are shown by black columns. ( e) Average RSA of Lys, Ser, Thr and Tyr residues for each target, with RSA values of these residues in beta strands compared with values for residues in all other residues, excluding beta strand residues. Beta strand Lys, Ser, Thr and Tyr are shown by grey columns. Lys, Ser, Thr and Tyr from all other residues, excluding beta strand residues, are shown by black columns. Numbers within columns refer to the number of each type of residue found in the crystal structure of each target.

