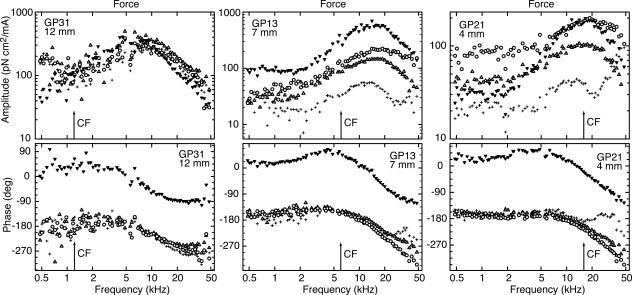
Fig. 3.
Force amplitudes (Upper) and phases (Lower) for three preparations at 12 (Left), 7 (Center), and 4 (Right) mm. Arrows, CFs calculated from the tonotopic map in Tsuji and Liberman (55): 1.2, 5.8, and 15.2 kHz. Data symbols are for IHCs (▾) and OHCs of the first (○), second (Δ), and third (+) rows. The maximum is most pronounced for the IHC. Above the frequency of the maximum, amplitudes and phases correspond to a low-pass filter of order between one and two. GPX, experiment identifier.

