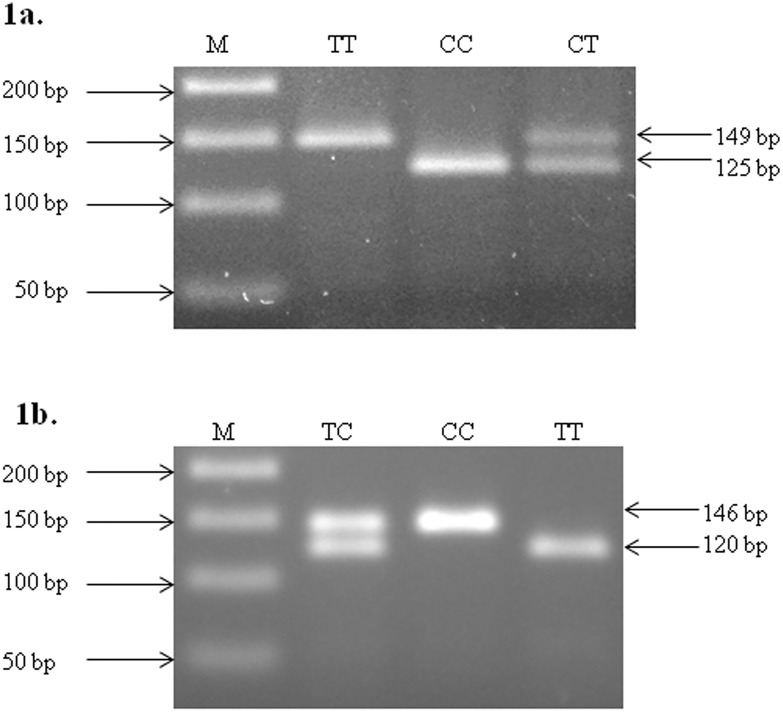
Fig 1. RFLP profiling of hsa-miR-196a-2 rs11614913 C>T (a) and hsa-miR-499 rs 3746444 T>C (b).
1a- 146 bp DNA fragment was amplified using PCR and incubated with MspI at 37°C for 12–16 hrs. Hsa-miR-196a-2 rs11614913 C>T genotype were deduced from migration profile on 2% agarose gel electrophoresis. Lane M shows 50bp molecular marker, wild type DNA visible in lane CC, heterozygous mutant in lane CT and homozygous mutant in lane TT. 1b- 149 bp DNA fragment was amplified using PCR, incubated with BclI at 37°C for 12–16 hrs, hsa-miR-499 rs 3746444 T>C genotype were deduced from migration profile on 2% agarose gel electrophoresis. Lane M shows 50bp molecular marker, wild type DNA visible in lane TT, heterozygous mutant in lane TC and homozygous mutant in lane CC.

