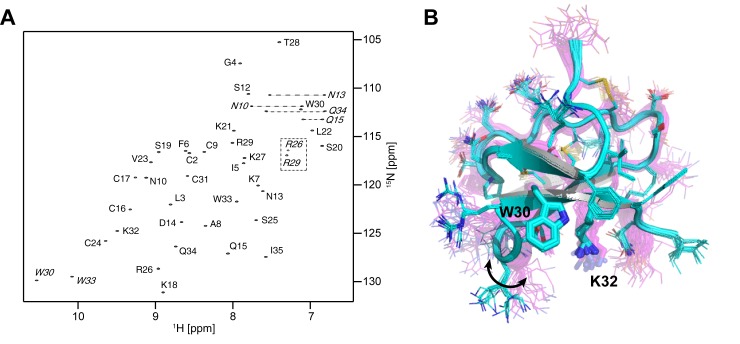
Fig 2.
(A) 1H-15N HSQC spectrum of m3-HwTx-IV. Peaks represent backbone amide NH correlations. Sidechain correlations are annotated with italic font and the folded arginine sidechains are marked with a dotted box. NH2 groups are connected using a dashed line. (B) High-resolution structure of m3-HwTx-IV. Ensemble of 20 structures are shown in cyan (PDBID: 5T3M). The sidechains are shown in line representation and the critical W30/K32 residues are shown in sticks. The structure of the WT peptide (1mb6) is shown in magenta but using the same line/stick representation as for the mutant structure. The higher resolution of the new structure is evident, particularly in the definition of sidechain orientations. The arrow highlights the variation in conformation of the dynamic loop 4 between the two structures.

