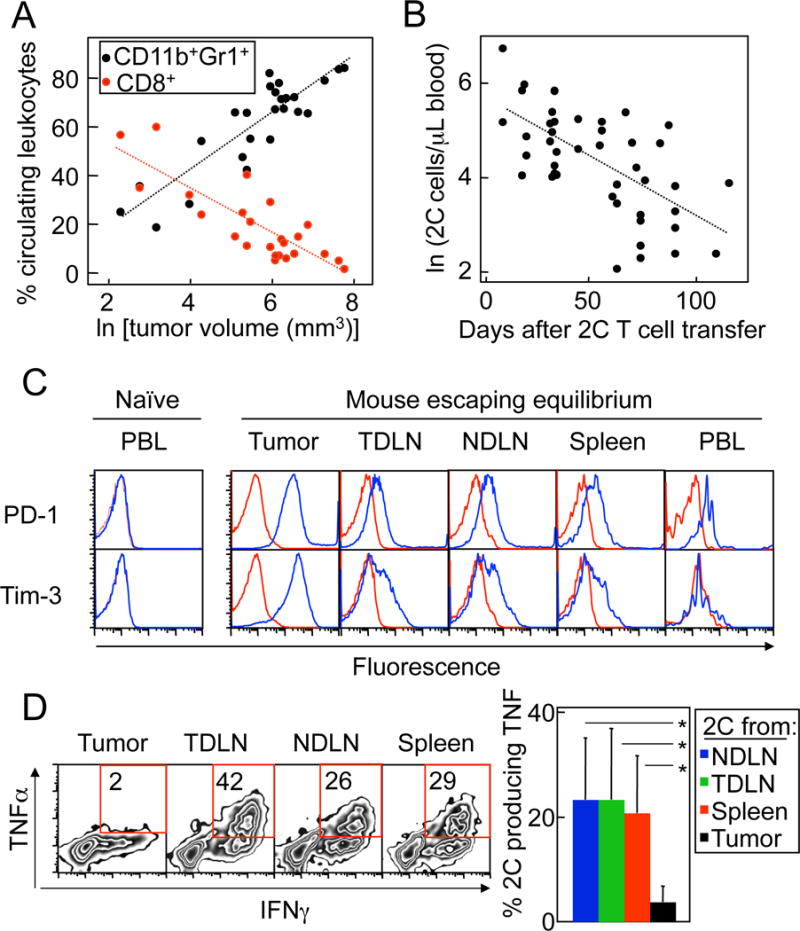
Figure 2. CD8+ T cells from mice with tumors relapsing after ATT showed decreased numbers in circulation and functional impairment in the tumor.

A. Decrease in CD8+ T cells and increase in MDSC in circulation with increasing tumor volumes. OT1-Rag−/− mice bearing PRO4L-SIY-EGFP tumors were treated with 2C cells on day 12–24 of tumor growth. Percentages of circulating CD11b+Gr1+ and total CD8+ T cells were plotted against the natural logarithm of tumor size in mm3. Data are from 14 mice and 8 experiments. Both the decrease in percent CD8+ and increase in percent CD11b+Gr1+ were highly statistically significant (P < 0.0001). The regression lines correspond to the following equations: for CD11b+Gr1+: y = 11.72x - 4.50, for CD8+ T cells: y = −9.16x + 71.43. B. Decrease in tumor Ag-specific CD8+ T cells with time after transfer. The absolute number of 2C cells (CD8+Vβ8+) per μL of blood was measured in mice treated as in (A). The natural logarithm of the number of 2C cells/μL of blood was calculated and plotted against the time after transfer. Data are from 23 mice and 13 experiments. The decrease in number of 2C/μL blood over time was highly statistically significant (P < 0.0001). The regression line corresponds to the equation y = −0.02x + 5.69. C. Upregulation of exhaustion markers by T cells isolated from tumors escaping equilibrium. Levels of expression of exhaustion markers PD-1 and Tim-3 were determined in 2C cells obtained from the indicated organs of a PRO4L-SIY-EGFP tumor-bearing OT1-Rag−/− mouse escaping equilibrium 63 days after ATT. Histograms are gated in 2C (CD8+Vβ8+) cells (blue: specific antibody; red: isotype control). A representative example is shown of a total of 6 repeats. D. Failure of T cells isolated from escaping tumors to produce TNF. The production of IFNγ and TNF by 2C cells from a mouse escaping equilibrium was analyzed by intracellular staining at day 91 since ATT. Gated: CD8+Vβ8+cells. Quadrants were determined based on staining with isotype control antibodies (not shown). FACS plots show a representative example out of 6 experiments performed with mice analyzed 43–98 days after 2C cell transfer. The bar graph shows pooled data on TNF production (n = 5–7 mice). The production of TNF by 2C was significantly lower in the tumor than in non-draining lymph nodes (NDLN, P = 0.028), tumor-draining lymph nodes (TDLN, P = 0.046) and spleen (P = 0.008) of the same mice.
