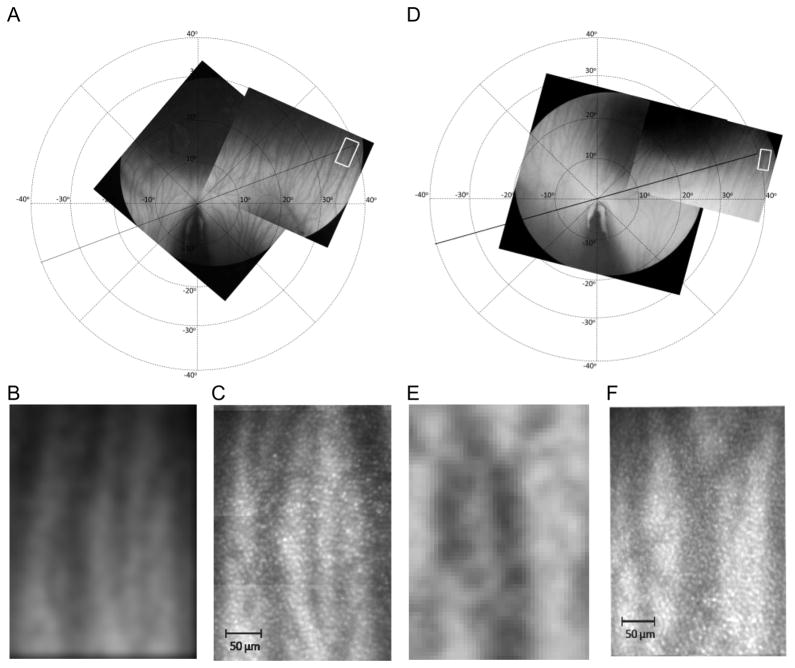
Figure 2.
(A) Montaged fundus photographs mapping the choroidal vasculature for chick A. The white rectangle indicates the retinal location where AO images were acquired i.e., 36° nasal and 12° superior from the tip of the pecten in the ventral field, (B) Cropped and enlarged fundus photograph from the white rectangle in (A) to show the landmark vasculature within the area, (C) Montaged AO image from the white box in (A): average cone density = 21,714±543 cones/mm2, NND range of 4.1 to 8.0 μm, Voronoi analyses of 43% hexagonal, 28% pentagonal, 19% heptagonal and 10% other with a cone domain of 51.1±15.5μm2 (D) Montaged fundus photographs mapping the choroidal vasculature for chick B. The AO images were acquired at 40° nasal and 12° superior from the tip of the pecten in the ventral field. (E) Cropped and enlarged fundus photograph from (D) (F) Montaged AO image from the white rectangle in (D): average cone density of 26,105±653 cones/mm2 cones/mm2, NND range of 4.3 to 7.9 μm, Voronoi analyses of 43% hexagonal, 28% pentagonal, 21% heptagonal and 8% other with a cone domain of 45.5±10.7 μm2. All the AO images were taken with 550 nm imaging light.

