Figure 1.

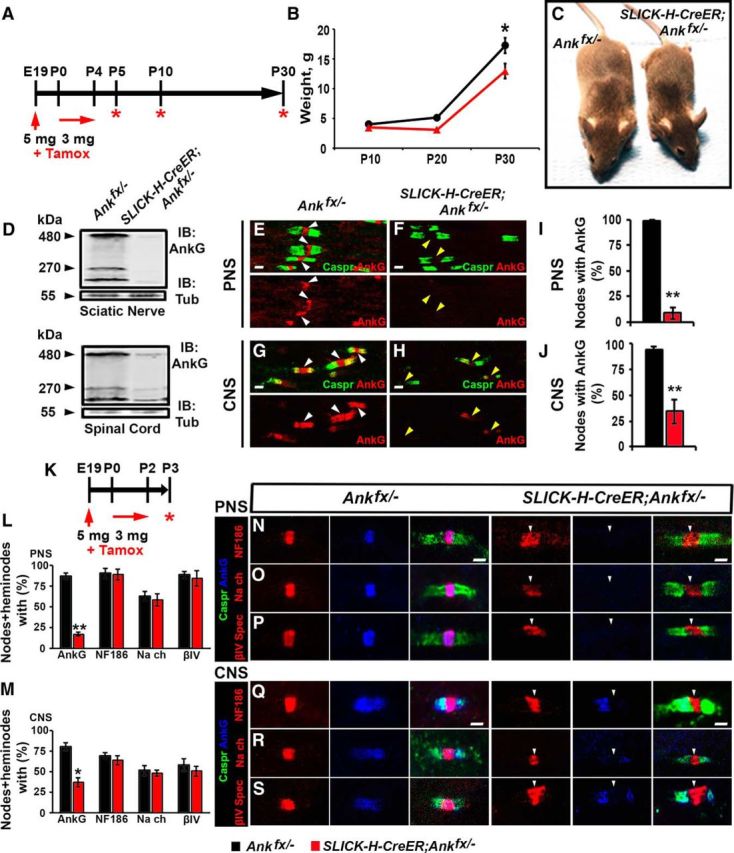
Perinatal neuron-specific AnkG ablation model. A, Schematic representation of tamoxifen injection for early AnkG ablation from neurons. Pregnant females were injected with a single dose of tamoxifen at E19, followed by daily intraperitoneal injections of tamoxifen to lactating dams for 5 consecutive days starting from the day pups were born. SLICK-H-CreER;Ankfx/− mutant and Ankfx/− control littermates were analyzed at P5, P10, and P30. B, Weight curves of Ankfx/− and SLICK-H-CreER;Ankfx/− male littermates (n = 6 mice/genotype; two-way ANOVA, Bonferroni's post hoc analysis). C, Photographic depiction of P30 SLICK-H-CreER;Ankfx/− and Ankfx/− mice after AnkG ablation by tamoxifen. D, Immunoblot analysis of SN and SC lysates from P5 Ankfx/− and SLICK-H-CreER;Ankfx/− mice with antibodies against AnkG and tubulin. E–H, Immunostaining of P5 teased SN fibers (E, F) and SCs (G, H) with antibodies against Caspr (green) and AnkG (red). White and yellow arrowheads indicate AnkG-positive and AnkG-negative nodes, respectively. I, J, Quantification of the percentage of nodes with AnkG in P5 Ankfx/− (black bar) and SLICK-H-CreER;Ankfx/− (red bar) SNs and SCs, respectively (n = 3 mice/genotype; 60–80 nodes/animal; unpaired, two-tailed Student's t test). K, Schematic of shortened tamoxifen injection protocol for perinatal AnkG ablation from neurons used for analysis of nodal formation at P3. L, M, Percentage of nodes and heminodes in SNs and SCs, respectively, with AnkG, NF186, pan-NaV, and βIV Spec at P3 in SLICK-H-CreER;Ankfx/− mice compared with Ankfx/− controls (n = 3 mice/genotype; 40 nodes/animal; unpaired, two-tailed Student's t test). N–S, Immunostaining of SN (N–P) and SC (Q–S) fibers from P3 age-matched Ankfx/− and SLICK-H-CreER;Ankfx/− littermate mice against AnkG (blue) in combination with either of the following proteins: NF186 (N, Q), pan-NaV (O, R), or βIV Spec (P, S; red), plus Caspr (green). Arrowheads indicate AnkG-negative nodes. Scale bar, 2 μm. All data are represented as the mean ± SEM. *p < 0.05; **p < 0.01; ***p < 0.001.
