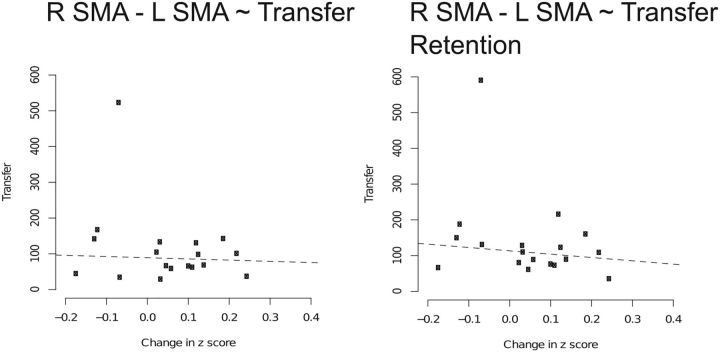
Figure 6.
Scatterplots indicating lack of correlation between change in functional connectivity and transfer. Line of best fit is derived from the corresponding robust regression model. Change in connectivity is quantified by a change in Z scores pre-training to post-training. Transfer was measured at post-training and also 1 week later at a retention test. Dashed lines indicate nonsignificant associations.

