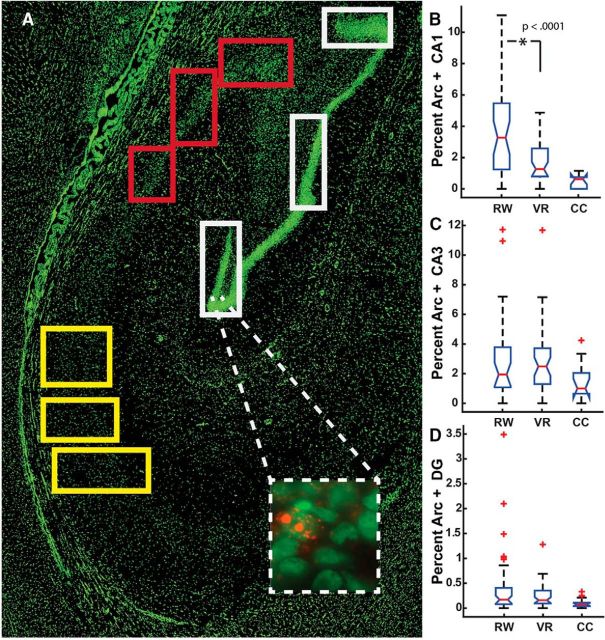
Figure 2.
Functional molecular imaging of behaviorally driven hippocampal activity. A, Representative 10× image showing a section of right posterior hippocampus. Nuclei were labeled with Sytox green. Colored boxes (i.e., panels) demonstrate the sampling scheme (white, dentate gyrus; red, CA3; and yellow, CA1). Inset, 40× image showing a cluster of dentate granule cells. Red dots indicate sites of intranuclear transcription of Arc mRNA. B–D, Box-and-whisker plots of regional proportions of neurons between experimental conditions (RW, real-world; VR, virtual reality). Red line represents sample median, box edges represent 25th and 75th percentiles, and whiskers extend 2.7 SDs. Red + symbols represent outliers. Only the CA1 region (B) showed significant differences in proportion of cells activated by real and virtual navigation. All navigation conditions were significantly different from CC.

