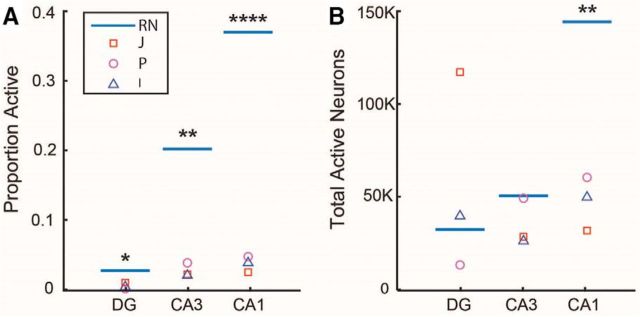
Figure 3.
Comparison of activity patterns in rodents and primates. A, Mean proportion of activated neurons reported in rodents (blue line, RN, Rattus norvegicus) and observed in individual primates (square, Monkey J; circle, Monkey P; triangle, Monkey I), highlighting the difference between species. B, Close concordance between the total numbers of neurons activated in the DG and CA3 regions. In contrast, the number of CA1 neurons activated in rats was significantly higher than in monkeys (*p < 0.05, **p < 0.01, ****p < 0.0001, monkeys vs rats in the same region).

