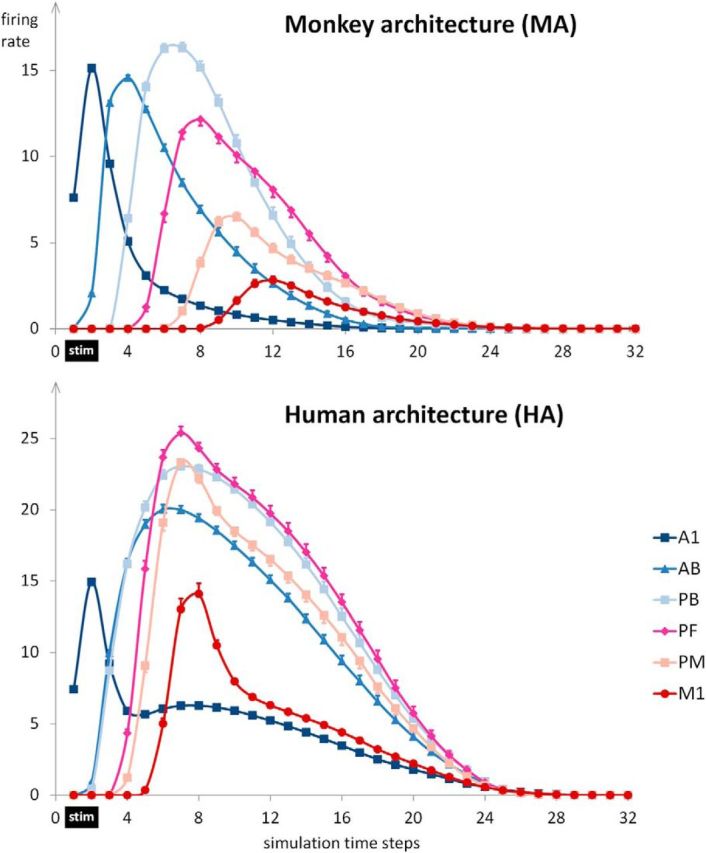
Figure 3.

Dynamics of network activation after sensory stimulation. The panels show the sum of firing rates after presenting the sensory components of previously learned patterns to A1. Stimulation was for the first two time steps (marked by a black bar, “stim”), and, following this, firing rates were recorded for 30 time steps. As the sum of firing rates is shown, this measure reflects the total amount of activity in an area rather than average firing rate per cell. Each data point represents the average of 12 network instances with 14 patterns per network (N = 168). Error bars show SEM after removing between-network variance (Morey, 2008).
