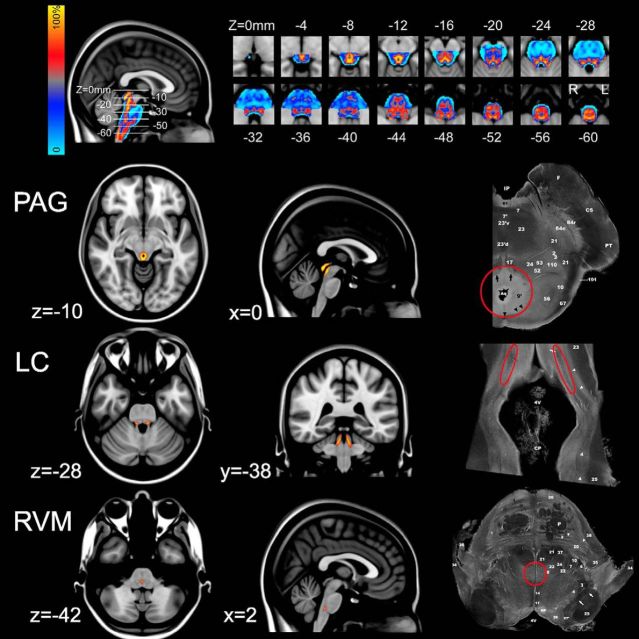
Figure 2.
Creation of probabilistic brainstem atlas. T2-weighted volumetric images acquired from the 20 healthy subjects were normalized (using the DARTEL technique) and segmented (using the VBM8 toolbox) into gray matter, white matter, or CSF. The gray matter probability maps were registered to one another, to create a probabilistic gray matter atlas (see top row). The color bar represents the probability of a given voxel being gray matter. The main areas of interest were the PAG, LC, and RVM, which were identified by thresholding the atlas at p > 0.7 (i.e., >70% chance of being gray matter) and then outlining the structures of interest on the basis of comparison to known anatomical landmarks taken from the Duvernoy brainstem atlas. Sections shown on the right hand side with structures of interest indicated by red circles (Naidich et al., 2009). All slice locations are given in the MNI coordinates.

