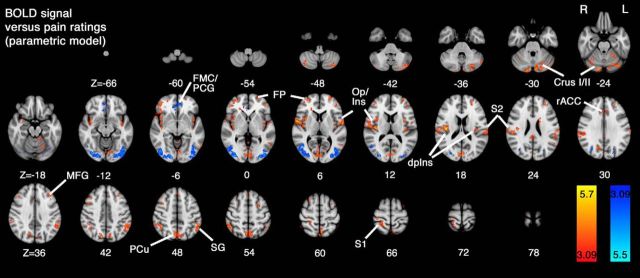
Figure 7.
Whole-brain analysis of intrasubject parametric regression obtained from pain ratings and BOLD signal measured across the 5 experimental conditions. Results from a mixed-effects one-sample group average model demonstrate regions where activity scales linearly in a positive direction (red-yellow) and in a negative direction (blue-light blue). Notably, the peak Z score was observed to lie in the dpIns, but also extended into the adjacent parietal operculum (Op)/S2 region represented bilaterally. Other regions demonstrating a linear relationship with pain ratings include areas of prefrontal cortex, cerebellum, supramarginal gyrus (SG), S1, and precuneus (PCu). Areas whose activity decreased in line with pain ratings included visual association areas (lateral occipital cortices [LOC]) and FMC/PCG. Data were obtained from cluster-based thresholding using an initial threshold of Z > 3.09 and corrected significance level of p < 0.05.

