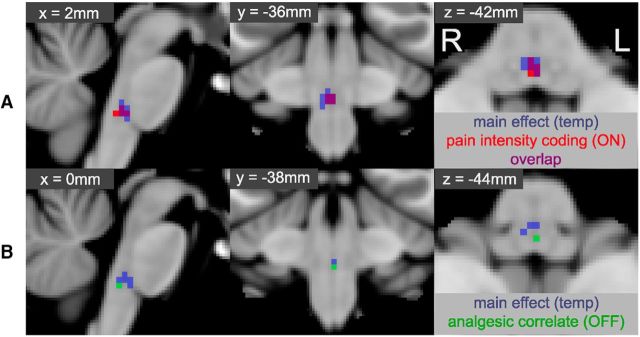
Figure 8.
Intrasubject and intersubject parametric regression of pain ratings and analgesia. Top row (A) represents the mixed-effects one-sample group average for the intrasubject parametric regression model using pain ratings and BOLD signal within the RVM (red). For comparison, the main effect of temperature for the RVM is show in blue, and the overlap depicted in purple. There is clear overlap between the area of activity identified in the main effect of temperature, and those voxels whose activity scaled linearly (up) with increasing pain ratings, suggestive of a role in pain intensity coding as has been observed with ON-cell activity. Bottom row (B) represents the equivalent intersubject parametric regression obtained using the difference in pain scores (ΔVAS = easy − hard, during high temperature stimulation) and the difference in BOLD signal (hard − easy, during high temperature stimulation). The region identified as reflecting magnitude of analgesic effect (green) lies within the RVM mask but is caudal to that responding linearly to increasing pain ratings. Activity that scales with the reported magnitude of pain reduction is suggestive of an analgesic role, which has previously been associated with OFF-cell activity. All data obtained by permutation testing with an RVM mask, and “activated” voxels reported for TFCE-corrected p < 0.05. Voxel coordinates are in MNI space and reflect the locations of the voxel with lowest p value for parametric pain intensity coding (A) and analgesic correlation (B).

