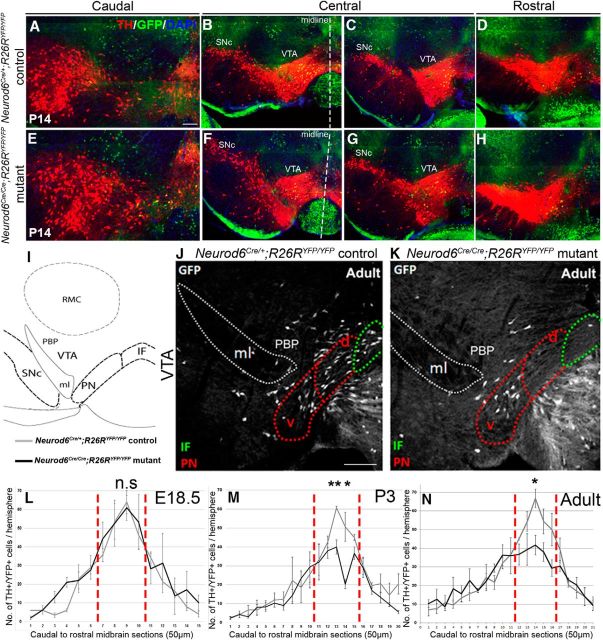
Figure 3.
Partial reduction in the number of Neurod6+ mDA neurons in the absence of NEUROD6 function. A–H, Immunohistochemistry for both YFP and TH on coronal sections from the caudal to the rostral extent of the mDA region at P14. Reduced numbers of YFP+/TH+ neurons are observed in the central mDA region (B, C, F, G), whereas there is no apparent change in the numbers of YFP+/TH+ mDA neurons in the rostral and caudal midbrain at P14. I, Schematic diagram showing the positions of mDA nuclei in the VTA and anatomical landmarks. J, K, Double antibody labeling of YFP and TH on a section through the central mDA region shows that YFP+/TH+ neurons are lost mostly in the dorsal region of the PN red dotted, PBP, and IF green dotted nuclei (only the YFP channel is shown). L–N, Graph showing the number of YFP+/TH+ mDA neurons analyzed by immunohistochemistry on coronal midbrain sections from the caudal to the rostral extent of the mDA region at different stages. Neurod6+ mDA neurons in the VTA are lost predominantly in the central mDA region corresponding to sections demarcated by red vertical lines. RMC, Reticular magnocellular nuclei of the red nucleus; ml, medial lemniscus; d, dorsal; v, ventral; n.s., not significant. Error bars indicate SEM. *p < 0.05 (Student's t test). **p < 0.01 (Student's t test). Dotted vertical lines indicate the midline of the section. Scale bars: A, 200 μm; J, 100 μm.

