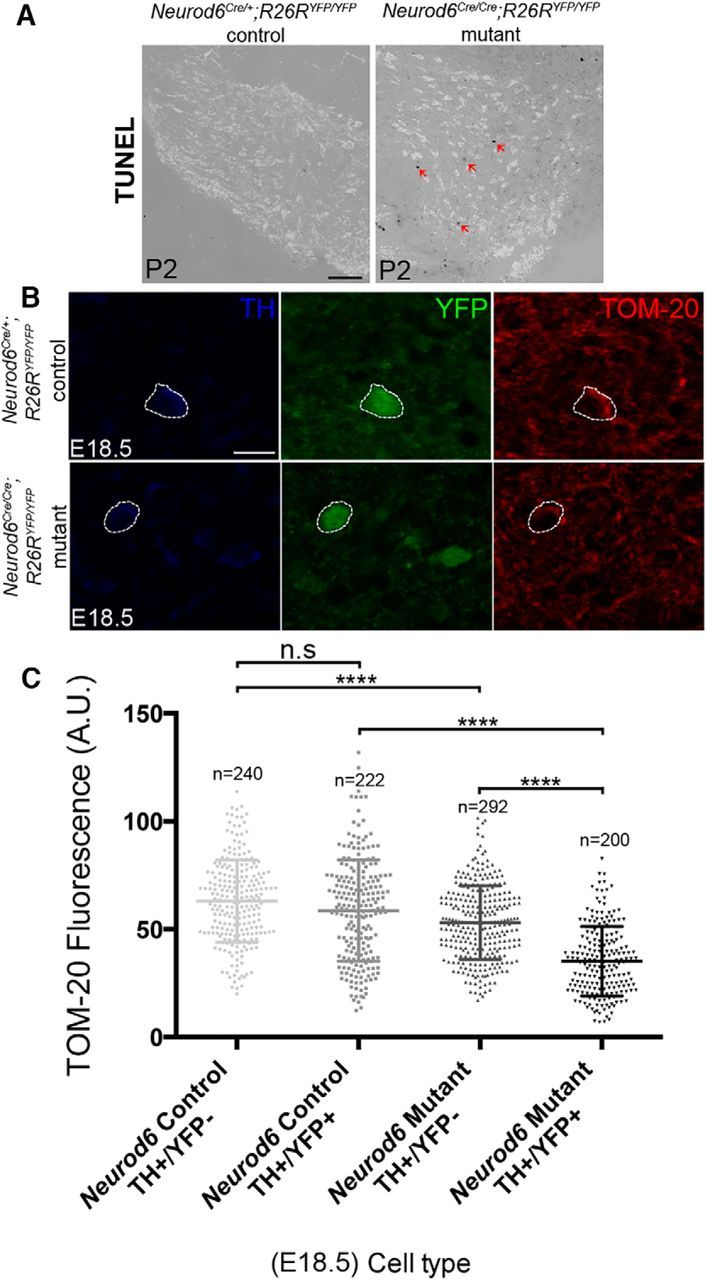
Figure 4.

Loss of NEUROD6 function results in cell death and reduced mitochondrial mass in mDA neurons. A, Apoptotic cells (arrowheads) revealed by TUNEL analysis are observed in the TH+ mDA region of Neurod6 mutant, but not in control pups at P2. B, A representative mDA neuron immunolabeled for TH, YFP, and TOM-20 that was used in quantitative analysis of mitochondrial mass. Dotted lines indicate cell boundary. C, Reduction in mitochondrial mass measured by the mean fluorescence (normalized to cell area) of neurons analyzed by immunohistochemistry with TOM20, TH, and YFP (A.U., arbitrary units) in Neurod6 control and mutant embryos at E18.5. n, Number of neurons analyzed. ****p < 0.0001 (one-way ANOVA, with Tukey's post test). Scale bars: A, 200 μm; B, 25 μm.
